Astec Industries/$ASTE
1D1W1MYTD1Y5YMAX
Capital at risk
About Astec Industries
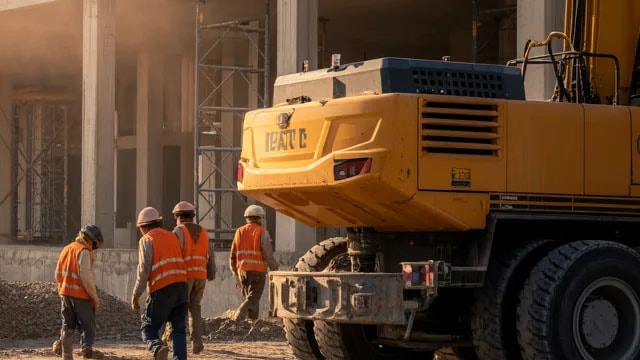
Astec Industries Inc designs and manufactures equipment and components used in road construction and other development activities. Its products are used through the entire process of building roads, from mining and crushing materials to creating the road surface. The company manufactures a line of plants, pavers, vehicles, and machines to mix and transform materials into construction components. The company has two operating segments: infrastructure solutions generating maximum revenue and materials solutions. The majority of sales are derived from the United States. Its customers are asphalt producers, highway and heavy equipment contractors, ready mix concrete producers, demolition recycling markets, sand and gravel producers, open mine operators, quarry operators, and others.
- Ticker
- $ASTE
- Sector
- Industrials
- Primary listing
- NASDAQ
- Employees
- 4,468
- Headquarters
- Chattanooga, United States
- Website
- www.astecindustries.com
Astec Industries Metrics
BasicAdvanced
$941M
48.44
$0.84
1.37
$0.52
1.27%
Price and volume
Market cap
$941M
Beta
1.37
52-week high
$65.69
52-week low
$39.99
Average daily volume
259K
Dividend rate
$0.52
Financial strength
Current ratio
2.517
Quick ratio
0.918
Long term debt to equity
0.53
Total debt to equity
0.571
Dividend payout ratio (TTM)
61.22%
Interest coverage (TTM)
2.87%
Profitability
EBITDA (TTM)
135.3
Gross margin (TTM)
26.17%
Net profit margin (TTM)
1.26%
Operating margin (TTM)
6.13%
Effective tax rate (TTM)
31.82%
Revenue per employee (TTM)
$350,000
Management effectiveness
Return on assets (TTM)
4.17%
Return on equity (TTM)
2.86%
Valuation
Price to earnings (TTM)
48.444
Price to revenue (TTM)
0.603
Price to book
1.36
Price to tangible book (TTM)
1.36
Price to free cash flow (TTM)
28.93
Free cash flow yield (TTM)
3.46%
Free cash flow per share (TTM)
1.413
Dividend yield (TTM)
1.27%
Forward dividend yield
1.27%
Growth
Revenue change (TTM)
18.70%
Earnings per share change (TTM)
-57.98%
3-year revenue growth (CAGR)
4.49%
10-year revenue growth (CAGR)
4.52%
3-year earnings per share growth (CAGR)
-8.34%
10-year earnings per share growth (CAGR)
-7.35%
3-year dividend per share growth (CAGR)
0.65%
10-year dividend per share growth (CAGR)
2.66%
What the Analysts think about Astec Industries
Analyst ratings (Buy, Hold, Sell) for Astec Industries stock.
Analyst projections of the future price of Astec Industries stock.
Bulls say / Bears say
Q2 2026 net sales rose 23.6% to $408.1 million and backlog increased 57.9% to $601.1 million, providing stronger revenue visibility than a year earlier. (ir.astecindustries.com) (Astec Industries)
Materials Solutions is showing strong momentum: Q2 sales increased 43.0%, segment adjusted EBITDA rose 54.5%, and parts-and-service revenue was a major contributor to growth. (ir.astecindustries.com) (Astec Industries)
Liquidity and cash generation provide financial flexibility: Astec reported $265.8 million of total liquidity, $52.8 million of year-to-date operating cash flow and $37.3 million of year-to-date free cash flow through Q2 2026. (ir.astecindustries.com) (Astec Industries)
Astec cut its 2026 adjusted EBITDA guidance to $160–$175 million from $170–$190 million, while Q2 GAAP net income fell 37.1% and diluted EPS declined 37.5% despite 23.6% sales growth. (ir.astecindustries.com) (Astec Industries)
Infrastructure Solutions showed weakening near-term demand: Q2 implied orders declined 20.0% sequentially, the book-to-bill ratio fell below 1.0x to 89.5%, and management cited macro-driven conservatism among asphalt-plant customers. (ir.astecindustries.com) (Astec Industries)
Astec remains exposed to elevated steel, freight, energy and tariff costs, while its multi-year ERP transformation is expected to cost $180–$200 million and debt stood at $365.4 million at June 30, 2026. (sec.gov) (SEC Form 10-Q)
Data summarised monthly by Lightyear AI. Last updated on 10 Sept 2026.
Astec Industries Financial Performance
Revenues and expenses
Astec Industries Earnings Performance
Company profitability
Upcoming events
No upcoming events
Astec Industries News
AllArticlesVideos
Funds containing Astec Industries
AllUSDGBPEUR
Fund name | Fund size | $ASTE weighting |
|---|---|---|
iShares S&P SmallCap 600$IDP6 | $3.2B | 0.06% |
iShares S&P Small Cap 600£ISP6 | £2.4B | 0.06% |
SPDR Russell 2000 US Small Cap€R2US | €4.8B | 0.03% |
iShares MSCI World Small Cap$WSML | $9B | 0.01% |
iShares MSCI World Small Cap€IUSN | €7.8B | 0.01% |
Data displayed above is indicative only and its accuracy or completeness is not guaranteed. Actual execution price may vary. Past performance is not indicative of future results. Your return may be affected by currency fluctuations and applicable fees and charges. Capital at risk.
Real-time US market data is sourced from the IEX order book provided by Polygon. After-hours US market data is 15 minutes delayed and may differ significantly from the actual tradable price at market open.