Baxter/$BAX
1D1W1M3M6MYTD1Y5YMAX
Capital at risk
About Baxter
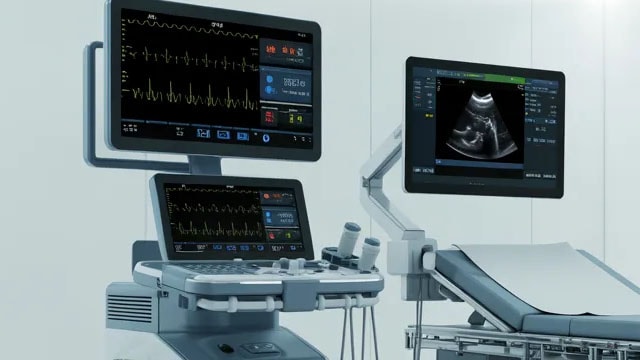
Baxter offers a variety of medical supplies and equipment to providers. From its legacy operations, Baxter sells injectable therapies for use in care settings, including IV pumps, administrative sets, and solutions; nutritional products; and surgical sealants and hemostatic agents. Baxter expanded its portfolio of hospital-focused offerings by acquiring Hillrom in late 2021, which added basic equipment like hospital beds, operating room equipment, and patient monitoring tools to the portfolio. Baxter also sold its kidney care tools in early 2025.
- Ticker
- $BAX
- Sector
- Health
- Primary listing
- NYSE
- Employees
- 37,500
- Headquarters
- Deerfield, United States
- Website
- www.baxter.com
Baxter Metrics
BasicAdvanced
$14B
-
-$1.40
0.67
$0.04
0.15%
Price and volume
Market cap
$14B
Beta
0.67
52-week high
$30.00
52-week low
$15.73
Average daily volume
6.9M
Dividend rate
$0.04
Financial strength
Current ratio
1.792
Quick ratio
1.003
Long term debt to equity
1.23
Total debt to equity
1.36
Interest coverage (TTM)
2.69%
Profitability
EBITDA (TTM)
1,833
Gross margin (TTM)
33.37%
Net profit margin (TTM)
-6.23%
Operating margin (TTM)
7.56%
Effective tax rate (TTM)
-231.02%
Revenue per employee (TTM)
$310,000
Management effectiveness
Return on assets (TTM)
2.81%
Return on equity (TTM)
-9.04%
Valuation
Price to revenue (TTM)
1.169
Price to book
2.1
Price to tangible book (TTM)
-5.94
Price to free cash flow (TTM)
11.968
Free cash flow yield (TTM)
8.36%
Free cash flow per share (TTM)
2.201
Dividend yield (TTM)
0.15%
Forward dividend yield
0.15%
Growth
Revenue change (TTM)
5.33%
Earnings per share change (TTM)
110.61%
3-year revenue growth (CAGR)
0.68%
10-year revenue growth (CAGR)
1.38%
3-year earnings per share growth (CAGR)
-35.03%
10-year earnings per share growth (CAGR)
-16.90%
3-year dividend per share growth (CAGR)
-67.45%
10-year dividend per share growth (CAGR)
-22.16%
What the Analysts think about Baxter
Analyst ratings (Buy, Hold, Sell) for Baxter stock.
Analyst projections of the future price of Baxter stock.
Bulls say / Bears say
Baxter raised its 2026 outlook again after third-quarter organic sales grew 5%. It now expects 3%–4% organic sales growth and adjusted earnings of $2.05–$2.15 per share, signalling improving execution. (Baxter)
Cash generation strengthened: free cash flow reached $448 million in the quarter and $705 million year to date. Baxter also retired $864 million of debt through a $600 million tender offer, supporting its deleveraging effort. (Baxter)
Advanced Surgery sales rose 12% and drug-compounding sales grew 9% in the third quarter. These growing businesses offer momentum beyond Baxter’s overall sales recovery. (StockAnalysis)
The FDA’s September warning letter found serious, repeated manufacturing-practice violations at Baxter’s Round Lake facility and cited similar failures elsewhere in its network. The agency said unresolved issues could lead to further inspections and restrict approvals of new drug applications. (FDA)
Baxter plans to stop making cephalosporin products at the end of October; these products are expected to contribute about $50 million in sales and $30 million in operating income in 2026. The exit may leave a hole in revenue and profit once existing customer commitments end. (StockAnalysis)
Adjusted earnings per share fell 16% year on year to $0.58 in the third quarter, despite 5% organic sales growth. Baxter attributed the decline to a higher effective tax rate, showing that stronger sales have not yet translated into higher adjusted earnings. (Baxter)
Data summarised monthly by Lightyear AI. Last updated on 29 Oct 2026.
Baxter Financial Performance
Revenues and expenses
Baxter Earnings Performance
Company profitability
Upcoming events
Baxter News
AllArticlesVideos


Funds containing Baxter
AllUSDEURGBP
Fund name | Fund size | $BAX weighting |
|---|---|---|
SPDR MSCI USA Small Cap Value Weighted$USSC | $1.1B | 0.35% |
Xtrackers S&P 500 Equal Weight£XDWE | $16B | 0.21% |
Xtrackers S&P 500 Equal Weight$XDEW | $16B | 0.21% |
iShares S&P 500 Equal Weight£EWSP | $5.6B | 0.21% |
iShares S&P 500 Equal Weight€O4J0 | $5.6B | 0.21% |
Data displayed above is indicative only and its accuracy or completeness is not guaranteed. Actual execution price may vary. Past performance is not indicative of future results. Your return may be affected by currency fluctuations and applicable fees and charges. Capital at risk.
Real-time US market data is sourced from the IEX order book provided by Polygon. After-hours US market data is 15 minutes delayed and may differ significantly from the actual tradable price at market open.