Cheesecake Factory/$CAKE
1D1W1MYTD1Y5YMAX
Capital at risk
About Cheesecake Factory
The Cheesecake Factory Inc is a restaurant company that owns and operates multiple casual dining brands across the United States and Canada under brands that include The Cheesecake Factory, North Italia, Flower Child, and additional brands within its Fox Restaurant Concepts portfolio. The company's international presence, in the Middle East and Mexico, is through licensing agreements with third parties. The company also has a bakery division that produces cheesecakes and other baked products for sale in its restaurants, international licensees, and third-party bakery customers. The company has four operating business segments: The Cheesecake Factory restaurants, North Italia, Other FRC, and Other. The majority of the company's revenue comes from the Cheesecake Factory restaurants segment.
- Ticker
- $CAKE
- Sector
- Consumer Discretionary
- Primary listing
- NASDAQ
- Employees
- 48,400
- Headquarters
- Calabasas, United States
- Website
- www.thecheesecakefactory.com
CAKE Metrics
BasicAdvanced
$5.2B
28.51
$3.69
1.01
$1.17
1.14%
Price and volume
Market cap
$5.2B
Beta
1.01
52-week high
$118.46
52-week low
$43.07
Average daily volume
1.5M
Dividend rate
$1.17
Financial strength
Current ratio
0.587
Quick ratio
0.434
Long term debt to equity
3.678
Total debt to equity
4.664
Dividend payout ratio (TTM)
30.96%
Interest coverage (TTM)
26.06%
Profitability
EBITDA (TTM)
353.833
Gross margin (TTM)
40.70%
Net profit margin (TTM)
4.61%
Operating margin (TTM)
6.25%
Effective tax rate (TTM)
9.07%
Revenue per employee (TTM)
$80,000
Management effectiveness
Return on assets (TTM)
4.70%
Return on equity (TTM)
38.83%
Valuation
Price to earnings (TTM)
28.508
Price to revenue (TTM)
1.264
Price to book
10.09
Price to tangible book (TTM)
19.61
Price to free cash flow (TTM)
23.887
Free cash flow yield (TTM)
4.19%
Free cash flow per share (TTM)
4.402
Dividend yield (TTM)
1.11%
Forward dividend yield
1.14%
Growth
Revenue change (TTM)
5.66%
Earnings per share change (TTM)
13.86%
3-year revenue growth (CAGR)
4.38%
10-year revenue growth (CAGR)
5.99%
3-year earnings per share growth (CAGR)
41.23%
10-year earnings per share growth (CAGR)
3.94%
3-year dividend per share growth (CAGR)
1.82%
10-year dividend per share growth (CAGR)
3.61%
What the Analysts think about CAKE
Analyst ratings (Buy, Hold, Sell) for Cheesecake Factory stock.
Analyst projections of the future price of Cheesecake Factory stock.
Bulls say / Bears say
The core Cheesecake Factory brand is gaining both price and customer traffic: second-quarter comparable sales rose 5.8%, including 2.7% traffic growth. Revenue passed $1 billion for the first time, while net income rose 25% and restaurant-level margin reached a decade high. (Morningstar, NRN)
CAKE has a credible multi-brand growth runway beyond its mature flagship. Flower Child comparable sales rose about 13%, and management expects up to 26 new restaurants in 2026, supporting its longer-term 7% annual unit-growth objective. (StockAnalysis, Morningstar)
The balance sheet has near-term flexibility: CAKE repaid its $69 million of notes due in 2026 and ended the second quarter with $561.7 million of available liquidity. It is still funding a $0.30 quarterly dividend and share repurchases, giving investors a direct cash-return element alongside operating growth. (StockTitan, MarketChameleon)
North Italia remains a weak link in the portfolio: its second-quarter comparable sales fell 3%, while its adjusted mature restaurant-level margin dropped to 15.6% from 18.2% a year earlier. Management is having to reinvest in value, lunch and marketing to repair the concept. (MetaTrader, StockAnalysis)
Margin gains still face cost pressure. Management expects low-single-digit commodity inflation and low-to-mid-single-digit labour inflation, while higher beef, produce and seafood costs already lifted cost of sales in the latest quarter. (StockAnalysis, MetaTrader)
The shares have rerated sharply, leaving less room for execution disappointments. Recent analysis put CAKE at about 22.7 times expected 2026 earnings and highlighted rising capital spending, a more promotional restaurant market and uncertain consumer demand as reasons the valuation may already discount much of the recovery. (Seeking Alpha, Simply Wall St)
Data summarised monthly by Lightyear AI. Last updated on 15 Sept 2026.
CAKE Financial Performance
Revenues and expenses
CAKE Earnings Performance
Company profitability
Upcoming events
No upcoming events
CAKE News
AllArticlesVideos
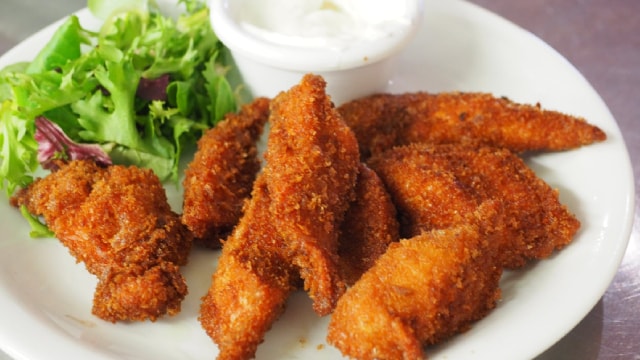
More CAKE: Cheesecake Factory stock is surprisingly beating these Magnificent 7 tech giants—including Nvidia
Fast Company4 weeks ago
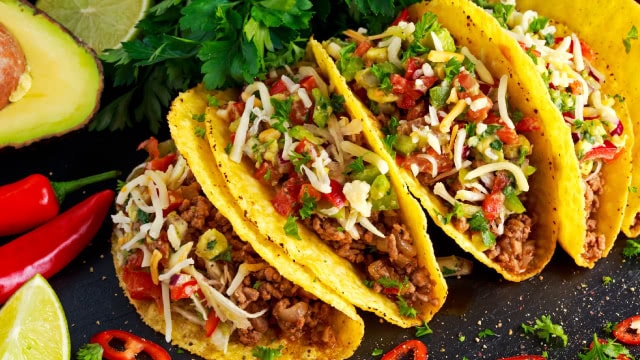
The Cheesecake Factory is closing locations: See a list of shuttered locations for 2026
Fast Company1 month ago
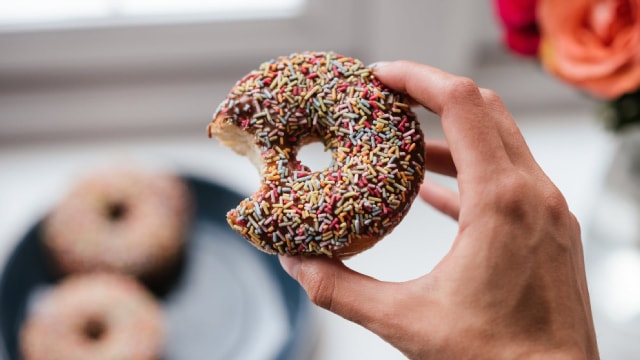
Surprisingly, Cheesecake Factory is one of the hottest food stocks right now. Here's why
Fast Company2 months ago
Funds containing CAKE
AllUSDGBPEUR
Fund name | Fund size | $CAKE weighting |
|---|---|---|
iShares S&P SmallCap 600$IDP6 | $3.2B | 0.28% |
iShares S&P Small Cap 600£ISP6 | £2.4B | 0.28% |
SPDR Russell 2000 US Small Cap€R2US | €4.8B | 0.16% |
SPDR Russell 2000 US Small Cap£R2SC | £4.1B | 0.16% |
iShares MSCI USA Small Cap ESG Enhanced CTB€SXRG | €2.8B | 0.05% |
Data displayed above is indicative only and its accuracy or completeness is not guaranteed. Actual execution price may vary. Past performance is not indicative of future results. Your return may be affected by currency fluctuations and applicable fees and charges. Capital at risk.
Real-time US market data is sourced from the IEX order book provided by Polygon. After-hours US market data is 15 minutes delayed and may differ significantly from the actual tradable price at market open.