Consolidated Water/$CWCO
1D1W1M3M6MYTD1Y5YMAX
Capital at risk
About Consolidated Water
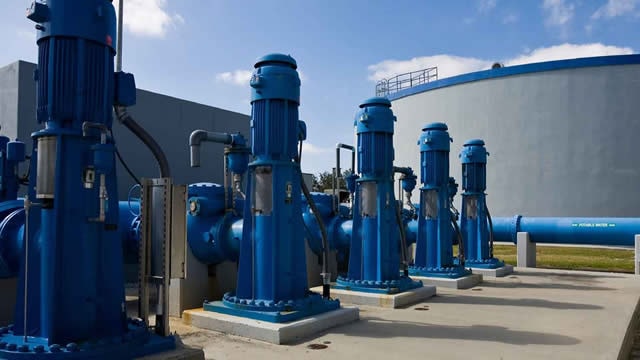
Consolidated Water Co Ltd is a water utility company. It develops and operates seawater desalination plants and water distribution systems. The company's business segments are; The retail segment operates the water utility for the Seven Mile Beach and West Bay areas of Grand Cayman Island, The bulk segment supplies potable water to government utilities in Grand Cayman and The Bahamas under long-term contracts, The services segment designs, constructs and sells water infrastructure and provides management and operating services to third parties. The manufacturing segment manufactures and services a wide range of custom and specialized water-related products applicable to commercial, municipal, and industrial water production, supply, and treatment, and the corporate segment.
- Ticker
- $CWCO
- Sector
- Utilities
- Primary listing
- NASDAQ
- Employees
- 293
- Headquarters
- Grand Cayman, Cayman Islands
- Website
- www.cwco.com
CWCO Metrics
BasicAdvanced
$436M
27.07
$1.01
0.52
$0.56
2.06%
Price and volume
Market cap
$436M
Beta
0.52
52-week high
$39.12
52-week low
$26.40
Average daily volume
113K
Dividend rate
$0.56
Financial strength
Current ratio
5.947
Quick ratio
5.626
Long term debt to equity
0.009
Total debt to equity
0.012
Dividend payout ratio (TTM)
55.39%
Interest coverage (TTM)
3,178.73%
Profitability
EBITDA (TTM)
22.682
Gross margin (TTM)
35.36%
Net profit margin (TTM)
12.66%
Operating margin (TTM)
12.26%
Effective tax rate (TTM)
8.74%
Revenue per employee (TTM)
$440,000
Management effectiveness
Return on assets (TTM)
3.76%
Return on equity (TTM)
7.51%
Valuation
Price to earnings (TTM)
27.067
Price to revenue (TTM)
3.405
Price to book
1.93
Price to tangible book (TTM)
2.07
Price to free cash flow (TTM)
14.381
Free cash flow yield (TTM)
6.95%
Free cash flow per share (TTM)
1.893
Dividend yield (TTM)
2.06%
Forward dividend yield
2.06%
Growth
Revenue change (TTM)
-1.16%
Earnings per share change (TTM)
1.84%
3-year revenue growth (CAGR)
-0.77%
10-year revenue growth (CAGR)
8.33%
3-year earnings per share growth (CAGR)
6.49%
10-year earnings per share growth (CAGR)
6.98%
3-year dividend per share growth (CAGR)
18.10%
10-year dividend per share growth (CAGR)
6.44%
Bulls say / Bears say
PERC Water won a $39.8 million design-build agreement for Pismo Beach’s water purification plant, adding a sizeable US project to CWCO’s order pipeline. Construction is expected to start in spring 2027. (Stockhouse)
CWCO secured a 25-year exclusive licence to supply water to Seven Mile Beach and West Bay in Grand Cayman. That long-term concession supports the durability of its core retail utility business. (SEC)
The company had $132.6 million in cash and $144.6 million in working capital at the end of June, with no significant debt. This gives it financial room to fund projects and pursue growth without relying heavily on borrowing. (SEC)
Second-quarter revenue fell 2% year on year and diluted EPS declined to $0.24 from $0.32, while gross margin narrowed to 33% from 38%. Manufacturing revenue fell 49%, and management expects it to be lower for full-year 2026 than in 2025. (SEC)
CWCO-Bahamas had $18.8 million due from the Bahamas Water and Sewerage Corporation at June-end, and roughly 64% was delinquent. The company said it could not determine when the overdue balance would be reduced, leaving collection risk. (SEC)
An archaeological permit is holding up other approvals for the $204 million Kalaeloa desalination project, creating uncertainty over when construction can begin. Delays could push expected project revenue and earnings further into the future. (Cayman Independent)
Data summarised monthly by Lightyear AI. Last updated on 14 Oct 2026.
CWCO Financial Performance
Revenues and expenses
CWCO Earnings Performance
Company profitability
Upcoming events
No upcoming events
CWCO News
AllArticlesVideos
Funds containing CWCO
Fund name | Fund size | $CWCO weighting |
|---|---|---|
iShares Global Water£IH2O | $2.2B | 0.23% |
iShares Global Water€IQQQ | $2.1B | 0.23% |
SPDR Russell 2000 US Small Cap€R2US | $5.3B | 0.01% |
SPDR Russell 2000 US Small Cap£R2SC | $5.3B | 0.01% |
Data displayed above is indicative only and its accuracy or completeness is not guaranteed. Actual execution price may vary. Past performance is not indicative of future results. Your return may be affected by currency fluctuations and applicable fees and charges. Capital at risk.
Real-time US market data is sourced from the IEX order book provided by Polygon. After-hours US market data is 15 minutes delayed and may differ significantly from the actual tradable price at market open.