Dollar General/$DG
14:30
16:10
17:45
19:25
21:00
1D1W1MYTD1Y5YMAX
About Dollar General
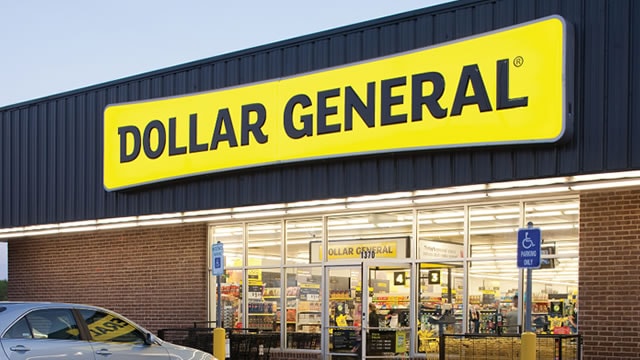
Since its beginning in 1939, Dollar General has grown to become the largest dollar store operator in the United States, with more than 20,000 small-box discount stores across 48 states. The firm generated $40 billion in fiscal 2024 sales. The retailer maintains a heavy concentration of stores in rural and low-income markets underserved by big-box retailers. It's 11,000 stock-keeping units, including 2,000 priced at $1 or less, span consumables (82% of sales), seasonal items (10%), home products (5%), and apparel (3%). More than 20% of sales are derived from private label.
Ticker
$DG
Sector
Primary listing
NYSE
Employees
194,200
Headquarters
Website
Dollar General Metrics
BasicAdvanced
$33B
25.50
$5.79
0.28
$2.36
1.60%
Price and volume
Market cap
$33B
Beta
0.28
52-week high
$154.75
52-week low
$69.32
Average daily volume
3.5M
Dividend rate
$2.36
Financial strength
Current ratio
1.171
Quick ratio
0.183
Long term debt to equity
182.852
Total debt to equity
201.663
Dividend payout ratio (TTM)
40.66%
Interest coverage (TTM)
8.68%
Profitability
EBITDA (TTM)
3,147.865
Gross margin (TTM)
30.41%
Net profit margin (TTM)
3.03%
Operating margin (TTM)
5.03%
Effective tax rate (TTM)
22.47%
Revenue per employee (TTM)
$220,000
Management effectiveness
Return on assets (TTM)
4.19%
Return on equity (TTM)
16.45%
Valuation
Price to earnings (TTM)
25.495
Price to revenue (TTM)
0.771
Price to book
3.97
Price to tangible book (TTM)
12.28
Price to free cash flow (TTM)
13.888
Free cash flow yield (TTM)
7.20%
Free cash flow per share (TTM)
10.632
Dividend yield (TTM)
1.60%
Forward dividend yield
1.60%
Growth
Revenue change (TTM)
4.86%
Earnings per share change (TTM)
-4.43%
3-year revenue growth (CAGR)
5.09%
10-year revenue growth (CAGR)
7.72%
3-year earnings per share growth (CAGR)
-17.41%
10-year earnings per share growth (CAGR)
4.23%
3-year dividend per share growth (CAGR)
4.47%
10-year dividend per share growth (CAGR)
13.59%
What the Analysts think about Dollar General
Analyst ratings (Buy, Hold, Sell) for Dollar General stock.
Dollar General Financial Performance
Revenues and expenses
Dollar General Earnings Performance
Company profitability
Dollar General News
AllArticlesVideos
Data displayed above is indicative only and its accuracy or completeness is not guaranteed. Actual execution price may vary. Past performance is not indicative of future results. Your return may be affected by currency fluctuations and applicable fees and charges. Capital at risk.
Real-time US market data is sourced from the IEX order book provided by Polygon. After-hours US market data is 15 minutes delayed and may differ significantly from the actual tradable price at market open.
Capital at risk
Upcoming events
No upcoming events
FAQs
What’s the current market cap for Dollar General stock?
Dollar General (DG) has a market cap of $33B as of January 28, 2026.
What is the P/E ratio for Dollar General stock?
The price to earnings (P/E) ratio for Dollar General (DG) stock is 25.5 as of January 28, 2026.
Does Dollar General stock pay dividends?
Yes, the Dollar General (DG) stock pays dividends to shareholders. As of January 28, 2026, the dividend rate is $2.36 and the yield is 1.6%. Dollar General has a payout ratio of 40.66% on a trailing twelve-month basis.
When is the next Dollar General dividend payment date?
The next Dollar General (DG) dividend payment date is unconfirmed.
What is the beta indicator for Dollar General?
Dollar General (DG) has a beta rating of 0.28. This means that it is less volatile than the market, on average. A beta of 1 would indicate the stock moves in-line with the market, while a beta of 0.5 would mean it moves half as much as the market.


