GlobalFoundries/$GFS
14:30
16:10
17:45
19:25
21:00
1D1W1MYTD1Y5YMAX
About GlobalFoundries
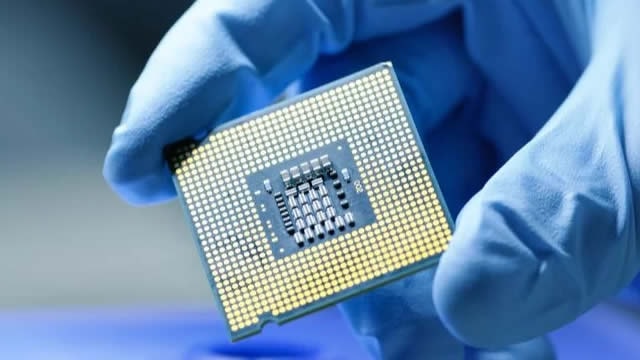
GlobalFoundries is a top-five contract semiconductor manufacturer globally. It was originally the manufacturing arm of Advanced Micro Devices before it was spun out in 2009. The foundry sells chips into a range of end markets including smartphones, PCs, Internet of Things, data centers, automotive, industrial, and so on, but primarily focuses on more mature process technologies. Until 2021, the firm was privately held by Mubadala Investment, the sovereign wealth fund of the United Arab Emirates, which remains its controlling shareholder today. GlobalFoundries merged with Chartered Semiconductor Manufacturing in 2009 and acquired IBM's chipmaking business in 2015. GF is headquartered in Malta, New York, and employs about 13,000 people.
Ticker
$GFS
Sector
Semiconductors
Primary listing
Employees
13,000
Headquarters
Website
GlobalFoundries Metrics
BasicAdvanced
$23B
-
-$0.09
1.48
-
Price and volume
Market cap
$23B
Beta
1.48
52-week high
$48.57
52-week low
$29.77
Average daily volume
5.3M
Financial strength
Current ratio
3.031
Quick ratio
2.212
Long term debt to equity
13.004
Total debt to equity
14.134
Interest coverage (TTM)
7.33%
Profitability
EBITDA (TTM)
2,100
Gross margin (TTM)
24.02%
Net profit margin (TTM)
-0.65%
Operating margin (TTM)
11.44%
Effective tax rate (TTM)
18.00%
Revenue per employee (TTM)
$520,000
Management effectiveness
Return on assets (TTM)
2.79%
Return on equity (TTM)
-0.35%
Valuation
Price to revenue (TTM)
3.441
Price to book
2
Price to tangible book (TTM)
2.18
Price to free cash flow (TTM)
20.059
Free cash flow yield (TTM)
4.99%
Free cash flow per share (TTM)
2.104
Growth
Revenue change (TTM)
0.25%
Earnings per share change (TTM)
-106.02%
3-year revenue growth (CAGR)
-4.73%
3-year earnings per share growth (CAGR)
-62.64%
What the Analysts think about GlobalFoundries
Analyst ratings (Buy, Hold, Sell) for GlobalFoundries stock.
GlobalFoundries Financial Performance
Revenues and expenses
GlobalFoundries Earnings Performance
Company profitability
GlobalFoundries News
AllArticlesVideos

GlobalFoundries downgraded on longer-than-expected semiconductor industry downturn
Proactive Investors·1 month ago

GlobalFoundries names Sam Franklin as CFO after interim stint
Reuters·2 months ago

GlobalFoundries buys Singapore's Advanced Micro Foundry in push to speed up AI data center networks
Reuters·3 months ago
Data displayed above is indicative only and its accuracy or completeness is not guaranteed. Actual execution price may vary. Past performance is not indicative of future results. Your return may be affected by currency fluctuations and applicable fees and charges. Capital at risk.
Real-time US market data is sourced from the IEX order book provided by Polygon. After-hours US market data is 15 minutes delayed and may differ significantly from the actual tradable price at market open.
Capital at risk
Upcoming events
No upcoming events
FAQs
What’s the current market cap for GlobalFoundries stock?
GlobalFoundries (GFS) has a market cap of $23B as of February 02, 2026.
What is the P/E ratio for GlobalFoundries stock?
The price to earnings (P/E) ratio for GlobalFoundries (GFS) stock is 0 as of February 02, 2026.
Does GlobalFoundries stock pay dividends?
No, GlobalFoundries (GFS) stock does not pay dividends to its shareholders as of February 02, 2026.
When is the next GlobalFoundries dividend payment date?
GlobalFoundries (GFS) stock does not pay dividends to its shareholders.
What is the beta indicator for GlobalFoundries?
GlobalFoundries (GFS) has a beta rating of 1.48. This means that it is more volatile than the market, on average. A beta of 1 would indicate the stock moves in-line with the market, while a beta of 2 would indicate the stock moves twice as much as the market.