Alphabet Class C/$GOOG
1D1W1MYTD1Y5YMAX
Capital at risk
About Alphabet Class C
Alphabet is a holding company that wholly owns internet giant Google. The California-based company derives slightly less than 90% of its revenue from Google services, the vast majority of which is advertising sales. Alongside online ads, Google services houses sales stemming from Google's subscription services (YouTube TV and YouTube Music, among others), platforms (sales and in-app purchases on Play Store), and devices (Chromebooks, Pixel smartphones, and smart home products such as Chromecast). Google's cloud computing platform accounts for roughly 10% of Alphabet's revenue. The firm's investments in up-and-coming technologies such as self-driving cars (Waymo), health (Verily), and internet access (Google Fiber) make up the rest.
- Ticker
- $GOOG
- Sector
- Software & Cloud Services
- Primary listing
- NASDAQ
- Employees
- 198,933
- Headquarters
- Mountain View, United States
- Website
- abc.xyz
Alphabet Class C Metrics
BasicAdvanced
$4.2T
17.13
$19.93
1.24
$0.86
0.26%
Price and volume
Market cap
$4.2T
Beta
1.24
52-week high
$404.47
52-week low
$236.69
Average daily volume
16M
Dividend rate
$0.86
Financial strength
Current ratio
2.724
Quick ratio
2.471
Long term debt to equity
0.176
Total debt to equity
0.189
Dividend payout ratio (TTM)
4.22%
Interest coverage (TTM)
200.58%
Profitability
EBITDA (TTM)
172,865
Gross margin (TTM)
60.90%
Net profit margin (TTM)
54.77%
Operating margin (TTM)
33.11%
Effective tax rate (TTM)
18.40%
Revenue per employee (TTM)
$2,240,000
Management effectiveness
Return on assets (TTM)
12.96%
Return on equity (TTM)
48.68%
Valuation
Price to earnings (TTM)
17.131
Price to revenue (TTM)
9.267
Price to book
6.75
Price to tangible book (TTM)
7.56
Price to free cash flow (TTM)
77.562
Free cash flow yield (TTM)
1.29%
Free cash flow per share (TTM)
4.402
Dividend yield (TTM)
0.25%
Forward dividend yield
0.26%
Growth
Revenue change (TTM)
20.05%
Earnings per share change (TTM)
112.48%
3-year revenue growth (CAGR)
15.48%
10-year revenue growth (CAGR)
18.49%
3-year earnings per share growth (CAGR)
61.61%
10-year earnings per share growth (CAGR)
31.49%
What the Analysts think about Alphabet Class C
Analyst ratings (Buy, Hold, Sell) for Alphabet Class C stock.
Analyst projections of the future price of Alphabet Class C stock.
Bulls say / Bears say
Alphabet delivered its 12th straight quarter of double-digit revenue growth, with Q2 2026 revenues rising 24% year-over-year to $119.8 billion on strong performance across both Google Services and Cloud. (SEC 8-K)
Google Cloud accelerated growth to 82% year-over-year in Q2 2026, generating $24.8 billion in revenue and tripling operating income to $8.8 billion, lifting the segment’s operating margin to around 36%. (Reuters Yahoo Finance)
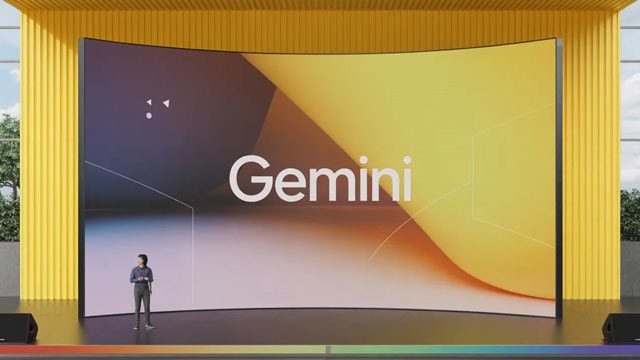
Enterprise adoption of Alphabet’s AI offerings remains robust, with nearly 90% of Fortune 100 companies using Gemini Enterprise and the models processing over 22 billion API tokens per minute, reinforcing Google Cloud’s competitive moat. (Reuters via Tiger Brokers)
Alphabet’s free cash flow turned negative in Q2 2026 after $44.9 billion in capital expenditures, prompting management to raise full-year CapEx guidance by $15 billion and stoking investor concerns over investment returns. (S&P Global Reuters via Yahoo Finance)
Regulatory risks are mounting after the European Commission upheld its 2018 Android antitrust ruling on July 2, 2026, potentially exposing Alphabet to additional fines and requiring changes to its mobile distribution agreements. (SEC Form 10-Q)
Investor sentiment has been dampened by delays in its flagship Gemini AI model and recent high-profile executive departures, contributing to a roughly 9% share price decline since late April 2026. (Reuters)
Data summarised monthly by Lightyear AI. Last updated on 27 Aug 2026.
Alphabet Class C Financial Performance
Revenues and expenses
Alphabet Class C Earnings Performance
Company profitability
Upcoming events
No upcoming events
Alphabet Class C News
AllArticlesVideos


Funds containing Alphabet Class C
AllEURGBPUSD
Fund name | Fund size | $GOOG weighting |
|---|---|---|
SPDR MSCI World Telecommunications€WTEL | €86M | 14.94% |
Amundi MSCI World ESG Broad Transition€LWCR | €1.1B | 3.52% |
iShares Dow Jones Global Titans 50€EXI2 | €2.9B | 3.17% |
Invesco EQQQ Nasdaq 100€EQQQ | €12B | 3.05% |
Xtrackers Nasdaq 100€XNAS | €2.2B | 3.05% |
Data displayed above is indicative only and its accuracy or completeness is not guaranteed. Actual execution price may vary. Past performance is not indicative of future results. Your return may be affected by currency fluctuations and applicable fees and charges. Capital at risk.
Real-time US market data is sourced from the IEX order book provided by Polygon. After-hours US market data is 15 minutes delayed and may differ significantly from the actual tradable price at market open.