Warrior Met Coal/$HCC
1D1W1MYTD1Y5YMAX
Capital at risk
About Warrior Met Coal
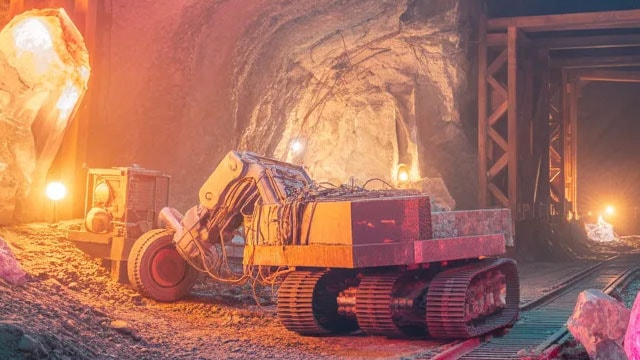
Warrior Met Coal Inc produces and exports met or steelmaking coal, which is used as a component for steel production by metal manufacturers in Europe, South America, and Asia. The company is involved in longwall mining operations in its underground mines based in Alabama, Mine No. 4, Mine No. 7, and Blue Creek. Additionally, its natural gas operations remove and sell natural gas from owned and leased coal seams by reducing natural gas levels in its mines. The company generates revenue mainly through the production of steelmaking coal for sale to the steel industry. Geographically, the firm generates maximum revenue from its customers in Asia, followed by Europe, South America, and the United States.
- Ticker
- $HCC
- Sector
- Materials
- Primary listing
- NYSE
- Employees
- 1,485
- Headquarters
- Brookwood, United States
- Website
- warriormetcoal.com
Warrior Met Coal Metrics
BasicAdvanced
$4.8B
22.02
$4.16
0.65
$0.32
0.35%
Price and volume
Market cap
$4.8B
Beta
0.65
52-week high
$111.42
52-week low
$60.70
Average daily volume
586K
Dividend rate
$0.32
Financial strength
Current ratio
3.927
Quick ratio
2.507
Long term debt to equity
0.089
Total debt to equity
0.103
Dividend payout ratio (TTM)
7.92%
Interest coverage (TTM)
17.06%
Profitability
EBITDA (TTM)
444.618
Gross margin (TTM)
30.60%
Net profit margin (TTM)
13.04%
Operating margin (TTM)
13.63%
Effective tax rate (TTM)
4.08%
Revenue per employee (TTM)
$1,130,000
Management effectiveness
Return on assets (TTM)
5.17%
Return on equity (TTM)
10.04%
Valuation
Price to earnings (TTM)
22.016
Price to revenue (TTM)
2.868
Price to book
2.11
Price to tangible book (TTM)
2.11
Price to free cash flow (TTM)
786.773
Free cash flow yield (TTM)
0.13%
Free cash flow per share (TTM)
0.116
Dividend yield (TTM)
0.35%
Forward dividend yield
0.35%
Growth
Revenue change (TTM)
37.61%
Earnings per share change (TTM)
440.74%
3-year revenue growth (CAGR)
1.21%
3-year earnings per share growth (CAGR)
-22.44%
3-year dividend per share growth (CAGR)
7.17%
What the Analysts think about Warrior Met Coal
Analyst ratings (Buy, Hold, Sell) for Warrior Met Coal stock.
Analyst projections of the future price of Warrior Met Coal stock.
Bulls say / Bears say
Blue Creek is moving from investment to earnings: Q2 sales rose 65% year on year, production rose 45%, and cash cost per ton fell 9% to $92.53. This combination is expanding margins as the new mine ramps. (Last10K, Warrior Met Coal)
The heavy Blue Creek construction spend is largely complete, allowing cash flow to improve sharply. Warrior generated $103.4 million of free cash flow in Q2, versus negative free cash flow a year earlier, and ended June with about $453 million of liquidity against $154.6 million of long-term debt. (Warrior Met Coal, Last10K)
Customer adoption is validating Blue Creek’s product and supports the volume outlook. Warrior raised 2026 sales guidance to 13.0–14.0 million short tons, with Blue Creek expected to sell 5 million tons and 90% of that volume already under contract. (Motley Fool, MarketBeat)
Warrior expects premium low-volatility coal prices to settle below the highs seen in the first half of 2026, while weak Chinese steel margins and subdued Chinese buying limit broader demand momentum. That points to a less supportive pricing environment in the second half. (Motley Fool, MarketBeat)
Warrior’s Q2 gross price realisation fell to about 66% of the premium low-volatility benchmark from 80% a year earlier. A higher High-Vol A sales mix, elevated freight to Asia and weak second-tier coal pricing are squeezing the benefit of higher volumes. (Warrior Met Coal, Motley Fool)
Execution remains a risk even after Blue Creek’s strong start: three longwall moves are planned in the second half of 2026, while labour negotiations, inflation in mining inputs and trade or tariff changes could disrupt volumes or raise costs. The company also remains exposed to rail and port disruptions because it exports its product. (Warrior Met Coal, Warrior Met Coal)
Data summarised monthly by Lightyear AI. Last updated on 15 Sept 2026.
Warrior Met Coal Financial Performance
Revenues and expenses
Warrior Met Coal Earnings Performance
Company profitability
Upcoming events
No upcoming events
Warrior Met Coal News
AllArticlesVideos

Funds containing Warrior Met Coal
AllUSDGBPEUR
Fund name | Fund size | $HCC weighting |
|---|---|---|
iShares S&P SmallCap 600$IDP6 | $3.2B | 0.29% |
iShares S&P Small Cap 600£ISP6 | £2.4B | 0.29% |
SPDR Russell 2000 US Small Cap€R2US | €4.8B | 0.16% |
iShares MSCI World Small Cap$WSML | $9B | 0.05% |
iShares MSCI World Small Cap€IUSN | €7.8B | 0.05% |
Data displayed above is indicative only and its accuracy or completeness is not guaranteed. Actual execution price may vary. Past performance is not indicative of future results. Your return may be affected by currency fluctuations and applicable fees and charges. Capital at risk.
Real-time US market data is sourced from the IEX order book provided by Polygon. After-hours US market data is 15 minutes delayed and may differ significantly from the actual tradable price at market open.