Lumexa Imaging Holdings/$LMRI
1D1W1M3M6MYTD1Y5YMAX
Capital at risk
About Lumexa Imaging Holdings
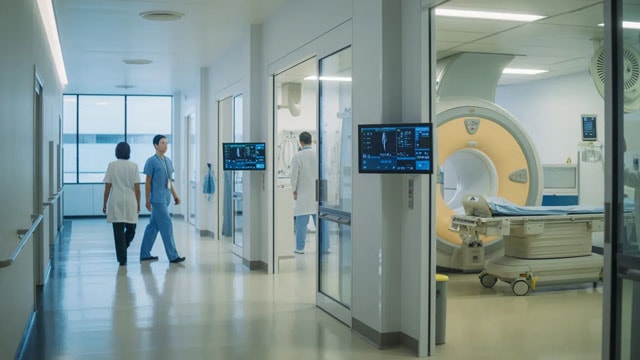
Lumexa Imaging Holdings Inc is a provider of diagnostic imaging services. The company offers a broad range of imaging modalities, including MRI, CT, PET, X-ray, ultrasound, and mammography. Its products and operations are managed and reported in two operating segments: Outpatient Imaging Centers (Outpatient) and Professional Services (Professional). The professional services segment generates revenue from interpreting imaging studies conducted by other parties, mainly hospital imaging departments. The majority of revenue is generated by the Outpatient segment, which performs imaging studies and provides radiologists' interpretations of those studies.
- Ticker
- $LMRI
- Sector
- Health
- Primary listing
- NASDAQ
- Employees
- 4,200
- Headquarters
- Raleigh, United States
- Website
- www.lumexaimaging.com
LMRI Metrics
BasicAdvanced
$1.3B
-
-$0.33
-
-
Price and volume
Market cap
$1.3B
52-week high
$19.45
52-week low
$6.45
Average daily volume
373K
Financial strength
Current ratio
1.438
Quick ratio
1.356
Long term debt to equity
1.517
Total debt to equity
1.586
Interest coverage (TTM)
0.43%
Profitability
EBITDA (TTM)
78.174
Gross margin (TTM)
14.90%
Net profit margin (TTM)
-2.66%
Operating margin (TTM)
3.46%
Effective tax rate (TTM)
-66.56%
Revenue per employee (TTM)
$250,000
Management effectiveness
Valuation
Price to revenue (TTM)
1.084
Price to book
2.1
Price to tangible book (TTM)
-5.56
Price to free cash flow (TTM)
36.205
Free cash flow yield (TTM)
2.76%
Free cash flow per share (TTM)
0.371
Growth
What the Analysts think about LMRI
Analyst ratings (Buy, Hold, Sell) for Lumexa Imaging Holdings stock.
Analyst projections of the future price of Lumexa Imaging Holdings stock.
Bulls say / Bears say
Advanced outpatient procedures grew 6.8% in Q2, while same-centre advanced volumes rose 5.2%. A rising share of higher-value scans could support further revenue growth. (Lumexa Imaging)
Lumexa added four centres in 2026 and is targeting eight to ten new-build openings this year. Its UPMC and Hospital for Special Surgery partnerships provide routes to expand through health-system joint ventures. (Lumexa Imaging, Lumexa Imaging)
Q2 revenue rose 5.1% and Lumexa returned to net profit from a year-earlier loss. It reiterated its 2026 revenue and adjusted EPS outlook, suggesting management still expects progress despite margin pressure. (Lumexa Imaging)
Q2 adjusted EBITDA was almost unchanged at $56.4 million despite higher revenue, and its margin fell to 21.4% from 22.4%. The company says new public-company costs reduce expected 2026 adjusted EBITDA growth to 4% at the guidance midpoint. (Lumexa Imaging)
The balance sheet remains highly leveraged: debt was about $835 million at June-end, and management reported leverage of 3.5 times after its IPO. It plans to lower that ratio mainly through EBITDA growth rather than paying debt down, leaving execution important to balance-sheet improvement. (SEC, Investing.com)
Lumexa depends on third-party payors for coverage and reimbursement, and its filing warns that failure to maintain adequate coverage or rates could hinder patient volumes and revenue. That leaves growth exposed to payor contract negotiations and reimbursement changes. (Publicnow)
Data summarised monthly by Lightyear AI. Last updated on 17 Oct 2026.
LMRI Financial Performance
Revenues and expenses
LMRI Earnings Performance
Company profitability
Upcoming events
No upcoming events
LMRI News
AllArticlesVideos
Funds containing LMRI
Fund name | Fund size | $LMRI weighting |
|---|---|---|
SPDR Russell 2000 US Small Cap€R2US | $5.3B | 0.01% |
SPDR Russell 2000 US Small Cap£R2SC | $5.3B | 0.01% |
Data displayed above is indicative only and its accuracy or completeness is not guaranteed. Actual execution price may vary. Past performance is not indicative of future results. Your return may be affected by currency fluctuations and applicable fees and charges. Capital at risk.
Real-time US market data is sourced from the IEX order book provided by Polygon. After-hours US market data is 15 minutes delayed and may differ significantly from the actual tradable price at market open.