Millrose Properties/$MRP
1D1W1MYTD1Y5YMAX
Capital at risk
About Millrose Properties
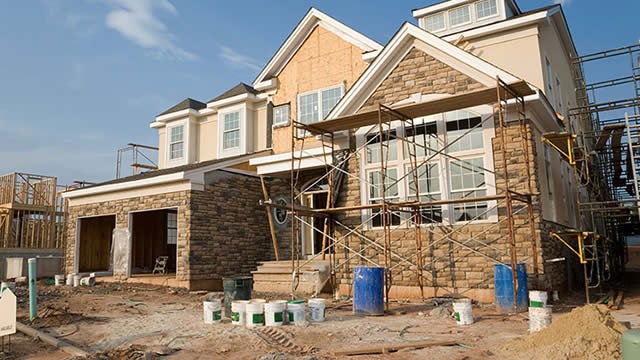
Millrose Properties Inc is a Holding Company. The company, along with its subsidiaries, engages in providing operational and capital solutions for home builders and land development companies to finance the acquisition and development of land assets through its Homesite Option Purchase Platform. The company generates a key portion of its revenue from Option fee revenues and a smaller portion of revenue from Development loan income.
- Ticker
- $MRP
- Sector
- Real Estate
- Primary listing
- NYSE
- Employees
- -
- Headquarters
- Miami, United States
- Website
- millroseproperties.com
MRP Metrics
BasicAdvanced
$4.9B
10.27
$2.87
-
$3.01
10.46%
Price and volume
Market cap
$4.9B
52-week high
$35.45
52-week low
$26.30
Average daily volume
1M
Dividend rate
$3.01
Financial strength
Current ratio
46.568
Quick ratio
0.164
Long term debt to equity
0.424
Total debt to equity
0.426
Dividend payout ratio (TTM)
102.19%
Interest coverage (TTM)
4.09%
Profitability
Gross margin (TTM)
85.31%
Net profit margin (TTM)
62.60%
Operating margin (TTM)
85.11%
Effective tax rate (TTM)
3.81%
Management effectiveness
Return on assets (TTM)
4.58%
Return on equity (TTM)
8.12%
Valuation
Price to earnings (TTM)
10.266
Price to revenue (TTM)
6.426
Price to book
0.84
Price to tangible book (TTM)
0.84
Price to free cash flow (TTM)
1.305
Free cash flow yield (TTM)
76.65%
Free cash flow per share (TTM)
22.565
Dividend yield (TTM)
10.22%
Forward dividend yield
10.46%
Growth
Revenue change (TTM)
228.24%
Earnings per share change (TTM)
890.64%
Bulls say / Bears say
Q2 2026 AFFO increased to $0.77 per share from $0.69 a year earlier, while Millrose announced its sixth consecutive quarterly dividend increase. This supports the case for strong near-term earnings and distribution momentum. (Millrose Q2 2026 results)
Millrose continued diversifying beyond Lennar, reaching 18 outside counterparties and adding a multifamily land-banking relationship with JPI, a Sumitomo Forestry subsidiary. Other-agreement invested capital grew to $2.8 billion and carried a 10.6% weighted-average yield versus 8.5% for the Lennar portfolio. (Millrose Q2 2026 results)
The platform reached $9.7 billion of homesites and related assets across 30 states, generated $1.0 billion of net homesite-sale proceeds during Q2, and reported $1.4 billion of liquidity. These figures provide substantial operating scale and funding capacity for further capital deployment. (Millrose Q2 2026 results)
Lennar remains a major concentration risk: it represented approximately $5.9 billion of Millrose’s $8.8 billion invested capital and 110,729 of 143,771 homesites as of June 30, 2026. (SEC 10-Q)
Millrose had $2.52 billion of debt outstanding, including $485 million of floating-rate revolver borrowings, and incurred $40.0 million of interest expense in Q2 2026. Higher rates or additional leverage could pressure AFFO and equity returns. (SEC 10-Q)
The $0.77 quarterly dividend equaled Q2 AFFO per share of $0.77, leaving little current-period cash retention to fund growth internally. Continued portfolio expansion may therefore require additional debt or equity capital. (Millrose Q2 2026 results)
Data summarised monthly by Lightyear AI. Last updated on 8 Sept 2026.
Upcoming events
No upcoming events
MRP News
AllArticlesVideos

Millrose Properties to Provide Capital Support for Dream Finders Homes' Announced Acquisition of Beazer Homes with Up to $1.25 Billion Commitment
Business Wire1 month ago
Millrose Properties Q2 Earnings Call Highlights
MarketBeat1 month ago

Millrose Properties Announces Quarterly Dividend Payment
Business Wire3 months ago
Funds containing MRP
AllUSDGBPEUR
Fund name | Fund size | $MRP weighting |
|---|---|---|
iShares S&P SmallCap 600$IDP6 | $3.2B | 0.26% |
iShares S&P Small Cap 600£ISP6 | £2.4B | 0.26% |
iShares MSCI USA Small Cap ESG Enhanced CTB€SXRG | €2.8B | 0.08% |
iShares MSCI USA Small Cap CTB Enhanced ESG£CUS1 | £2.4B | 0.08% |
iShares MSCI World Small Cap$WSML | $9B | 0.04% |
Data displayed above is indicative only and its accuracy or completeness is not guaranteed. Actual execution price may vary. Past performance is not indicative of future results. Your return may be affected by currency fluctuations and applicable fees and charges. Capital at risk.
Real-time US market data is sourced from the IEX order book provided by Polygon. After-hours US market data is 15 minutes delayed and may differ significantly from the actual tradable price at market open.