ArcelorMittal/$MT
14:30
16:10
17:45
19:25
21:00
1D1W1MYTD1Y5YMAX
About ArcelorMittal
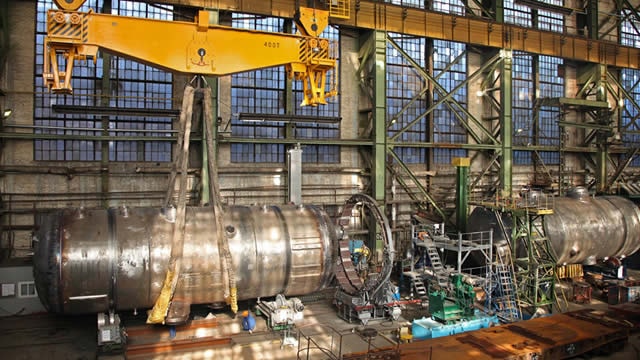
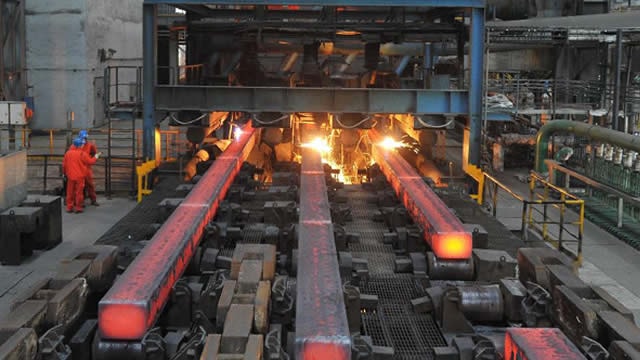
ArcelorMittal SA is involved in the steel industry. The company's operating segments include North America, Brazil, Europe, India and JVs, Sustainable Solutions, Mining and Other . It generates maximum revenue from the Europe segment. Europe segment produces hot-rolled coil, cold-rolled coil, coated products, tinplate, plate, and slab. These products are sold to customers in the automotive, general, and packaging sectors as well as also produce long products consisting of sections, wire rods, rebar, billets, blooms and wire drawing, and tubular products. Geographically, it derives a majority of its revenue from United States.
Ticker
$MT
Sector
Primary listing
NYSE
Employees
125,416
Headquarters
Luxembourg, Luxembourg
Website
ArcelorMittal Metrics
BasicAdvanced
$41B
16.06
$3.36
1.68
$0.47
0.87%
Price and volume
Market cap
$41B
Beta
1.68
52-week high
$56.93
52-week low
$23.20
Average daily volume
1.4M
Dividend rate
$0.47
Financial strength
Current ratio
1.386
Quick ratio
0.436
Long term debt to equity
18.51
Total debt to equity
26.232
Dividend payout ratio (TTM)
15.59%
Interest coverage (TTM)
4.68%
Profitability
EBITDA (TTM)
5,550
Gross margin (TTM)
9.53%
Net profit margin (TTM)
4.23%
Operating margin (TTM)
4.88%
Effective tax rate (TTM)
33.09%
Revenue per employee (TTM)
$490,000
Management effectiveness
Return on assets (TTM)
1.94%
Return on equity (TTM)
4.72%
Valuation
Price to earnings (TTM)
16.058
Price to revenue (TTM)
0.676
Price to book
0.64
Price to tangible book (TTM)
0.71
Price to free cash flow (TTM)
711.62
Free cash flow yield (TTM)
0.14%
Free cash flow per share (TTM)
0.076
Dividend yield (TTM)
0.87%
Forward dividend yield
0.87%
Growth
Revenue change (TTM)
-1.90%
Earnings per share change (TTM)
-317.97%
3-year revenue growth (CAGR)
-9.98%
10-year revenue growth (CAGR)
-1.11%
3-year earnings per share growth (CAGR)
-37.67%
10-year earnings per share growth (CAGR)
0.94%
3-year dividend per share growth (CAGR)
13.12%
10-year dividend per share growth (CAGR)
-0.87%
What the Analysts think about ArcelorMittal
Analyst ratings (Buy, Hold, Sell) for ArcelorMittal stock.
ArcelorMittal Financial Performance
Revenues and expenses
ArcelorMittal Earnings Performance
Company profitability
ArcelorMittal News
AllArticlesVideos
Data displayed above is indicative only and its accuracy or completeness is not guaranteed. Actual execution price may vary. Past performance is not indicative of future results. Your return may be affected by currency fluctuations and applicable fees and charges. Capital at risk.
Real-time US market data is sourced from the IEX order book provided by Polygon. After-hours US market data is 15 minutes delayed and may differ significantly from the actual tradable price at market open.
Capital at risk
Upcoming events
No upcoming events
FAQs
What’s the current market cap for ArcelorMittal stock?
ArcelorMittal (MT) has a market cap of $41B as of February 02, 2026.
What is the P/E ratio for ArcelorMittal stock?
The price to earnings (P/E) ratio for ArcelorMittal (MT) stock is 16.06 as of February 02, 2026.
Does ArcelorMittal stock pay dividends?
Yes, the ArcelorMittal (MT) stock pays dividends to shareholders. As of February 02, 2026, the dividend rate is $0.4675 and the yield is 0.87%. ArcelorMittal has a payout ratio of 15.59% on a trailing twelve-month basis.
When is the next ArcelorMittal dividend payment date?
The next ArcelorMittal (MT) dividend payment date is unconfirmed.
What is the beta indicator for ArcelorMittal?
ArcelorMittal (MT) has a beta rating of 1.68. This means that it is more volatile than the market, on average. A beta of 1 would indicate the stock moves in-line with the market, while a beta of 2 would indicate the stock moves twice as much as the market.


