Northrop Grumman/$NOC
14:30
16:10
17:45
19:25
21:00
1D1W1MYTD1Y5YMAX
About Northrop Grumman
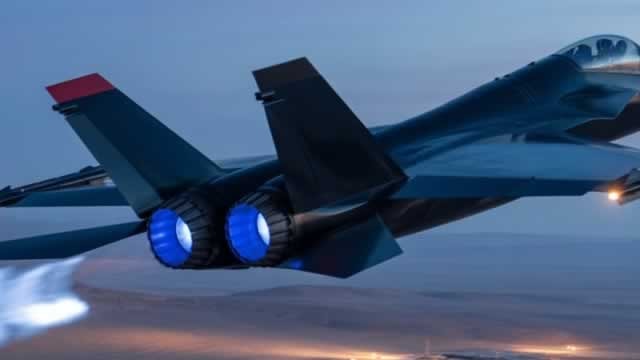
Northrop Grumman is a diversified defense contractor providing aeronautics, defense, and space systems. The company's aerospace segment produces autonomous and piloted aircraft such as Global Hawk drones and the new B-21 bomber, creates the fuselage for the massive F-35 program, and maintains and upgrades numerous other military aircraft. Defense systems makes artillery and missile ammunition and guidance systems, long-range missiles, and missile defense systems. Mission systems creates and integrates a variety of radar, navigation, and communication systems for avionics, weapons control, and countermeasures on a range of platforms from helicopters to destroyers. Space systems produces satellites, sensors, space structures, and rocket motors.
Ticker
$NOC
Sector
Primary listing
NYSE
Employees
97,000
Headquarters
Website
Northrop Grumman Metrics
BasicAdvanced
$95B
23.98
$27.81
0.10
$8.99
1.39%
Price and volume
Market cap
$95B
Beta
0.1
52-week high
$669.68
52-week low
$426.24
Average daily volume
879K
Dividend rate
$8.99
Financial strength
Current ratio
1.109
Quick ratio
0.863
Long term debt to equity
106.067
Total debt to equity
109.401
Dividend payout ratio (TTM)
31.43%
Interest coverage (TTM)
7.84%
Profitability
EBITDA (TTM)
6,577
Gross margin (TTM)
19.42%
Net profit margin (TTM)
9.82%
Operating margin (TTM)
12.45%
Effective tax rate (TTM)
17.63%
Revenue per employee (TTM)
$420,000
Management effectiveness
Return on assets (TTM)
6.53%
Return on equity (TTM)
26.15%
Valuation
Price to earnings (TTM)
23.979
Price to revenue (TTM)
2.35
Price to book
5.96
Price to tangible book (TTM)
-57.09
Price to free cash flow (TTM)
52.445
Free cash flow yield (TTM)
1.91%
Free cash flow per share (TTM)
12.716
Dividend yield (TTM)
1.35%
Forward dividend yield
1.39%
Growth
Revenue change (TTM)
-0.14%
Earnings per share change (TTM)
73.89%
3-year revenue growth (CAGR)
5.15%
10-year revenue growth (CAGR)
5.51%
3-year earnings per share growth (CAGR)
-7.65%
10-year earnings per share growth (CAGR)
10.38%
3-year dividend per share growth (CAGR)
9.81%
10-year dividend per share growth (CAGR)
11.29%
What the Analysts think about Northrop Grumman
Analyst ratings (Buy, Hold, Sell) for Northrop Grumman stock.
Northrop Grumman Financial Performance
Revenues and expenses
Northrop Grumman Earnings Performance
Company profitability
Northrop Grumman News
AllArticlesVideos
Data displayed above is indicative only and its accuracy or completeness is not guaranteed. Actual execution price may vary. Past performance is not indicative of future results. Your return may be affected by currency fluctuations and applicable fees and charges. Capital at risk.
Real-time US market data is sourced from the IEX order book provided by Polygon. After-hours US market data is 15 minutes delayed and may differ significantly from the actual tradable price at market open.
Capital at risk
Upcoming events
No upcoming events
FAQs
What’s the current market cap for Northrop Grumman stock?
Northrop Grumman (NOC) has a market cap of $95B as of January 17, 2026.
What is the P/E ratio for Northrop Grumman stock?
The price to earnings (P/E) ratio for Northrop Grumman (NOC) stock is 23.98 as of January 17, 2026.
Does Northrop Grumman stock pay dividends?
Yes, the Northrop Grumman (NOC) stock pays dividends to shareholders. As of January 17, 2026, the dividend rate is $8.99 and the yield is 1.39%. Northrop Grumman has a payout ratio of 31.43% on a trailing twelve-month basis.
When is the next Northrop Grumman dividend payment date?
The next Northrop Grumman (NOC) dividend payment date is unconfirmed.
What is the beta indicator for Northrop Grumman?
Northrop Grumman (NOC) has a beta rating of 0.1. This means that it is less volatile than the market, on average. A beta of 1 would indicate the stock moves in-line with the market, while a beta of 0.5 would mean it moves half as much as the market.


