Nucor/$NUE
1D1W1MYTD1Y5YMAX
Capital at risk
About Nucor
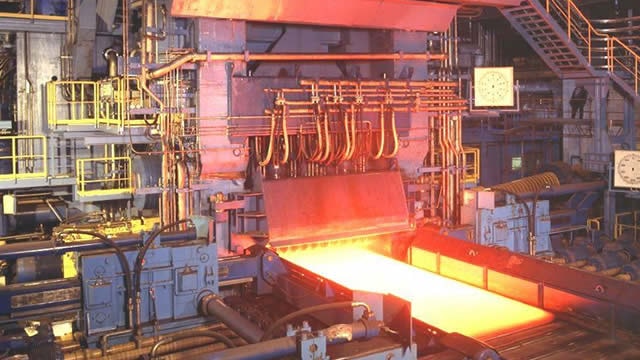
Nucor Corp manufactures steel and steel products. The company's reportable segments are steel mills, steel products, and raw materials. The majority of its revenue is derived from the steel mills segment, which is engaged in producing sheet steel (hot-rolled, cold-rolled, and galvanized), plate steel, structural steel (wide-flange beams, beam blanks, H-piling, and sheet piling), and bar steel products. Nucor manufactures steel principally from scrap steel and scrap steel substitutes using electric arc furnaces (EAFs), along with continuous casting and automated rolling mills. The steel mills segment sells its products mainly to steel service centers, fabricators, and manufacturers located in the United States, Canada, and Mexico.
- Ticker
- $NUE
- Sector
- Materials
- Primary listing
- NYSE
- Employees
- 33,000
- Headquarters
- Charlotte, United States
- Website
- nucor.com
Nucor Metrics
BasicAdvanced
$58B
20.33
$12.52
1.89
$2.23
0.88%
Price and volume
Market cap
$58B
Beta
1.89
52-week high
$280.11
52-week low
$131.32
Average daily volume
1.4M
Dividend rate
$2.23
Financial strength
Current ratio
2.508
Quick ratio
1.284
Long term debt to equity
0.275
Total debt to equity
0.305
Dividend payout ratio (TTM)
17.75%
Interest coverage (TTM)
28.74%
Profitability
EBITDA (TTM)
5,681
Gross margin (TTM)
15.55%
Net profit margin (TTM)
7.99%
Operating margin (TTM)
11.55%
Effective tax rate (TTM)
20.68%
Revenue per employee (TTM)
$1,090,000
Management effectiveness
Return on assets (TTM)
7.32%
Return on equity (TTM)
14.55%
Valuation
Price to earnings (TTM)
20.332
Price to revenue (TTM)
1.616
Price to book
2.63
Price to tangible book (TTM)
3.83
Price to free cash flow (TTM)
36.859
Free cash flow yield (TTM)
2.71%
Free cash flow per share (TTM)
6.908
Dividend yield (TTM)
0.88%
Forward dividend yield
0.88%
Growth
Revenue change (TTM)
17.19%
Earnings per share change (TTM)
126.72%
3-year revenue growth (CAGR)
-1.22%
10-year revenue growth (CAGR)
8.72%
3-year earnings per share growth (CAGR)
-16.68%
10-year earnings per share growth (CAGR)
33.87%
3-year dividend per share growth (CAGR)
3.18%
10-year dividend per share growth (CAGR)
4.06%
What the Analysts think about Nucor
Analyst ratings (Buy, Hold, Sell) for Nucor stock.
Analyst projections of the future price of Nucor stock.
Bulls say / Bears say
Nucor beat Wall Street estimates for second-quarter adjusted EPS of $4.84 (consensus $4.38) and revenue of $10.4 billion (consensus $10.14 billion), driven by strong pricing and record steel mill volumes (Reuters).
Nucor’s external average sales price per ton rose 10% year-over-year to $1,367, outpacing the 2% increase in average scrap costs and boosting metal margins (Nasdaq).
Favorable U.S. trade policies have constrained imports and supported firmer domestic steel prices, underpinning Nucor’s pricing power and competitive positioning (Reuters).
Average scrap and scrap substitute cost per gross ton rose 4% quarter-over-quarter to $422, narrowing metal margins if pricing momentum falters (Nasdaq).
Quarterly sheet steel shipments declined 3% sequentially to 3.29 million tons, suggesting potential softness in key end-markets like automotive and construction (Nasdaq).
Nucor expects raw materials segment earnings to decrease in the third quarter due to lower margins from reduced scrap pricing and elevated input costs, signalling a drag on near-term profitability (PRNewswire).
Data summarised monthly by Lightyear AI. Last updated on 24 Aug 2026.
Nucor Financial Performance
Revenues and expenses
Nucor Earnings Performance
Company profitability
Upcoming events
No upcoming events
Nucor News
AllArticlesVideos


Funds containing Nucor
AllEURGBPUSD
Fund name | Fund size | $NUE weighting |
|---|---|---|
iShares S&P 500 Materials Sector€2B7B | €186M | 5.01% |
iShares S&P 500 Materials Sector£IMSU | £160M | 5.01% |
SPDR MSCI World Materials€WMAT | €198M | 1.90% |
SPDR S&P US Dividend Aristocrats€SPYD | €3.3B | 0.49% |
SPDR S&P US Dividend Aristocrats£USDV | £2.8B | 0.49% |
Data displayed above is indicative only and its accuracy or completeness is not guaranteed. Actual execution price may vary. Past performance is not indicative of future results. Your return may be affected by currency fluctuations and applicable fees and charges. Capital at risk.
Real-time US market data is sourced from the IEX order book provided by Polygon. After-hours US market data is 15 minutes delayed and may differ significantly from the actual tradable price at market open.