Steel Dynamics/$STLD
14:30
16:10
17:45
19:25
21:00
1D1W1MYTD1Y5YMAX
About Steel Dynamics
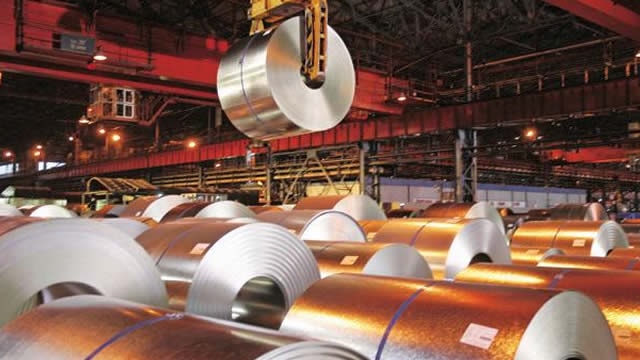
Steel Dynamics Inc operates as a domestic steel producer and metal recycler in the United States. The company's product portfolio comprises hot rolled sheet, hot rolled plate, painted sheet products, cold rolled sheet, and others. Its reportable segments are steel operations, metals recycling operations, steel fabrication operations, and aluminum operations. Maximum revenue is generated from its steel operations segment, which consists of manufacturing various steel products and numerous coating operations. Its primary sources of revenue are currently from the manufacture and sale of steel products, the processing and sale of recycled ferrous and nonferrous metals, and the fabrication and sale of steel joists and deck products.
Ticker
$STLD
Sector
Primary listing
Employees
13,000
Headquarters
Website
Steel Dynamics Metrics
BasicAdvanced
$27B
23.35
$7.99
1.48
$2.00
1.07%
Price and volume
Market cap
$27B
Beta
1.48
52-week high
$186.62
52-week low
$103.17
Average daily volume
1.3M
Dividend rate
$2.00
Financial strength
Current ratio
3.055
Quick ratio
1.156
Long term debt to equity
46.767
Total debt to equity
47.155
Dividend payout ratio (TTM)
24.56%
Interest coverage (TTM)
21.07%
Profitability
EBITDA (TTM)
2,027.376
Gross margin (TTM)
13.16%
Net profit margin (TTM)
6.52%
Operating margin (TTM)
8.12%
Effective tax rate (TTM)
20.47%
Revenue per employee (TTM)
$1,400,000
Management effectiveness
Return on assets (TTM)
5.89%
Return on equity (TTM)
13.28%
Valuation
Price to earnings (TTM)
23.348
Price to revenue (TTM)
1.517
Price to book
3.03
Price to tangible book (TTM)
3.33
Price to free cash flow (TTM)
54.981
Free cash flow yield (TTM)
1.82%
Free cash flow per share (TTM)
3.393
Dividend yield (TTM)
1.07%
Forward dividend yield
1.07%
Growth
Revenue change (TTM)
3.63%
Earnings per share change (TTM)
-18.80%
3-year revenue growth (CAGR)
-6.53%
10-year revenue growth (CAGR)
9.12%
3-year earnings per share growth (CAGR)
-27.45%
10-year earnings per share growth (CAGR)
30.92%
3-year dividend per share growth (CAGR)
13.72%
10-year dividend per share growth (CAGR)
13.78%
What the Analysts think about Steel Dynamics
Analyst ratings (Buy, Hold, Sell) for Steel Dynamics stock.
Steel Dynamics Financial Performance
Revenues and expenses
Steel Dynamics Earnings Performance
Company profitability
Steel Dynamics News
AllArticlesVideos
Data displayed above is indicative only and its accuracy or completeness is not guaranteed. Actual execution price may vary. Past performance is not indicative of future results. Your return may be affected by currency fluctuations and applicable fees and charges. Capital at risk.
Real-time US market data is sourced from the IEX order book provided by Polygon. After-hours US market data is 15 minutes delayed and may differ significantly from the actual tradable price at market open.
Capital at risk
Upcoming events
No upcoming events
FAQs
What’s the current market cap for Steel Dynamics stock?
Steel Dynamics (STLD) has a market cap of $27B as of February 03, 2026.
What is the P/E ratio for Steel Dynamics stock?
The price to earnings (P/E) ratio for Steel Dynamics (STLD) stock is 23.35 as of February 03, 2026.
Does Steel Dynamics stock pay dividends?
Yes, the Steel Dynamics (STLD) stock pays dividends to shareholders. As of February 03, 2026, the dividend rate is $2 and the yield is 1.07%. Steel Dynamics has a payout ratio of 24.56% on a trailing twelve-month basis.
When is the next Steel Dynamics dividend payment date?
The next Steel Dynamics (STLD) dividend payment date is unconfirmed.
What is the beta indicator for Steel Dynamics?
Steel Dynamics (STLD) has a beta rating of 1.48. This means that it is more volatile than the market, on average. A beta of 1 would indicate the stock moves in-line with the market, while a beta of 2 would indicate the stock moves twice as much as the market.


