Taiwan Semiconductor Manufacturing/$TSM
14:30
16:10
17:45
19:25
21:00
1D1W1MYTD1Y5YMAX
About Taiwan Semiconductor Manufacturing
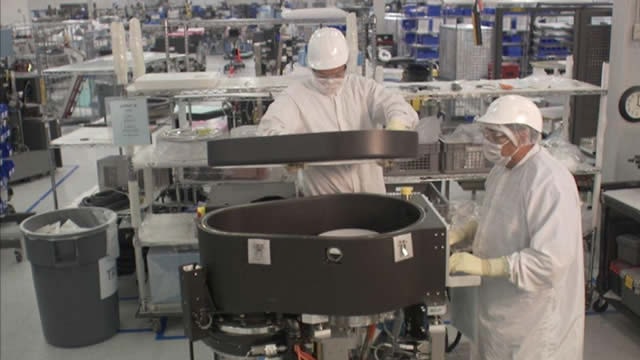
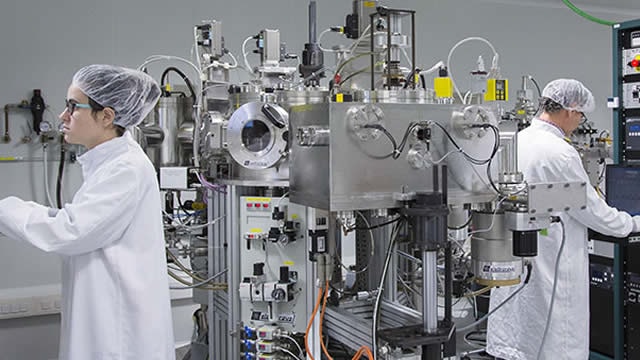
Taiwan Semiconductor Manufacturing Co. is the world's largest dedicated chip foundry, with mid-60s market share in 2024. TSMC was founded in 1987 as a joint venture of Philips, the government of Taiwan, and private investors. It went public in Taiwan in 1994 and as an ADR in the US in 1997. TSMC's scale and high-quality technology allow the firm to generate solid operating margins, even in the highly competitive foundry business. Furthermore, the shift to the fabless business model has created tailwinds for TSMC. The foundry leader has an illustrious base of customers, including Apple, AMD, and Nvidia, that look to apply its cutting-edge process technologies to their semiconductor designs. TSMC employs more than 83,000 people.
Ticker
$TSM
Sector
Semiconductors
Primary listing
NYSE
Employees
83,825
Headquarters
Hsinchu City, Taiwan, Province of China
Website
TSM Metrics
BasicAdvanced
$1.4T
33.76
$9.59
1.27
$2.43
0.78%
Price and volume
Market cap
$1.4T
Beta
1.27
52-week high
$333.08
52-week low
$134.25
Average daily volume
11M
Dividend rate
$2.43
Financial strength
Current ratio
2.693
Quick ratio
2.397
Long term debt to equity
17.484
Total debt to equity
18.998
Dividend payout ratio (TTM)
28.05%
Interest coverage (TTM)
171.32%
Profitability
EBITDA (TTM)
392,957.54
Gross margin (TTM)
58.98%
Net profit margin (TTM)
43.29%
Operating margin (TTM)
49.53%
Effective tax rate (TTM)
17.31%
Revenue per employee (TTM)
$6,851,050
Management effectiveness
Return on assets (TTM)
16.63%
Return on equity (TTM)
34.66%
Valuation
Price to earnings (TTM)
33.757
Price to revenue (TTM)
14.61
Price to book
8.72
Price to tangible book (TTM)
8.76
Price to free cash flow (TTM)
59.67
Free cash flow yield (TTM)
1.68%
Free cash flow per share (TTM)
5.424
Dividend yield (TTM)
0.75%
Forward dividend yield
0.78%
Growth
Revenue change (TTM)
36.96%
Earnings per share change (TTM)
49.64%
3-year revenue growth (CAGR)
20.48%
10-year revenue growth (CAGR)
15.46%
3-year earnings per share growth (CAGR)
21.21%
10-year earnings per share growth (CAGR)
17.85%
3-year dividend per share growth (CAGR)
23.06%
10-year dividend per share growth (CAGR)
16.37%
What the Analysts think about TSM
Analyst ratings (Buy, Hold, Sell) for Taiwan Semiconductor Manufacturing stock.
TSM Financial Performance
Revenues and expenses
TSM Earnings Performance
Company profitability
TSM News
AllArticlesVideos
Data displayed above is indicative only and its accuracy or completeness is not guaranteed. Actual execution price may vary. Past performance is not indicative of future results. Your return may be affected by currency fluctuations and applicable fees and charges. Capital at risk.
Real-time US market data is sourced from the IEX order book provided by Polygon. After-hours US market data is 15 minutes delayed and may differ significantly from the actual tradable price at market open.
Capital at risk
Upcoming events
FAQs
What’s the current market cap for Taiwan Semiconductor Manufacturing stock?
Taiwan Semiconductor Manufacturing (TSM) has a market cap of $1.4T as of January 11, 2026.
What is the P/E ratio for Taiwan Semiconductor Manufacturing stock?
The price to earnings (P/E) ratio for Taiwan Semiconductor Manufacturing (TSM) stock is 33.76 as of January 11, 2026.
Does Taiwan Semiconductor Manufacturing stock pay dividends?
Yes, the Taiwan Semiconductor Manufacturing (TSM) stock pays dividends to shareholders. As of January 11, 2026, the dividend rate is $2.42955 and the yield is 0.78%. Taiwan Semiconductor Manufacturing has a payout ratio of 28.05% on a trailing twelve-month basis.
When is the next Taiwan Semiconductor Manufacturing dividend payment date?
The next Taiwan Semiconductor Manufacturing (TSM) dividend payment is scheduled for April 09, 2026.
What is the beta indicator for Taiwan Semiconductor Manufacturing?
Taiwan Semiconductor Manufacturing (TSM) has a beta rating of 1.27. This means that it is more volatile than the market, on average. A beta of 1 would indicate the stock moves in-line with the market, while a beta of 2 would indicate the stock moves twice as much as the market.


