Waste Management/$WM
14:30
16:10
17:45
19:25
21:00
1D1W1MYTD1Y5YMAX
About Waste Management
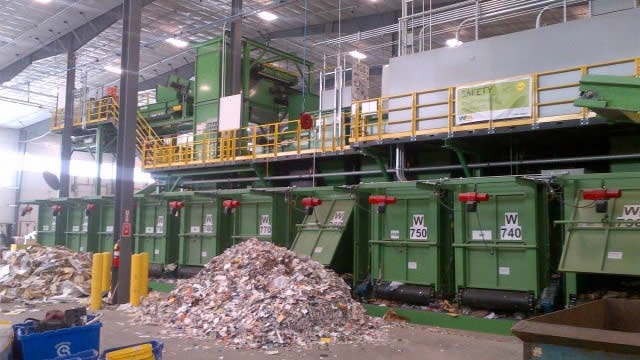
WM, previously known as Waste Management, ranks as the largest integrated provider of traditional solid waste services in the United States, operating 262 active landfill sites and about 339 transfer stations that help with transporting waste efficiently and economically. The company serves residential, commercial, industrial, and medical end markets for waste collection, transfer, and disposal. The company also has an energy business emanating from the beneficial use of landfill gas and is a leading recycler in North America.
Ticker
$WM
Sector
Business services
Primary listing
NYSE
Employees
60,500
Headquarters
Website
Waste Management Metrics
BasicAdvanced
$93B
34.37
$6.70
0.59
$3.30
1.43%
Price and volume
Market cap
$93B
Beta
0.59
52-week high
$242.58
52-week low
$194.11
Average daily volume
2.4M
Dividend rate
$3.30
Financial strength
Current ratio
0.889
Quick ratio
0.77
Long term debt to equity
230.618
Total debt to equity
229.276
Dividend payout ratio (TTM)
49.26%
Interest coverage (TTM)
5.17%
Profitability
EBITDA (TTM)
7,559
Gross margin (TTM)
40.44%
Net profit margin (TTM)
10.74%
Operating margin (TTM)
18.70%
Effective tax rate (TTM)
20.93%
Revenue per employee (TTM)
$420,000
Management effectiveness
Return on assets (TTM)
6.52%
Return on equity (TTM)
29.70%
Valuation
Price to earnings (TTM)
34.375
Price to revenue (TTM)
3.68
Price to book
9.29
Price to tangible book (TTM)
-12.12
Price to free cash flow (TTM)
32.935
Free cash flow yield (TTM)
3.04%
Free cash flow per share (TTM)
6.993
Dividend yield (TTM)
1.43%
Forward dividend yield
1.43%
Growth
Revenue change (TTM)
14.24%
Earnings per share change (TTM)
-1.62%
3-year revenue growth (CAGR)
8.56%
10-year revenue growth (CAGR)
6.88%
3-year earnings per share growth (CAGR)
7.52%
10-year earnings per share growth (CAGR)
15.04%
3-year dividend per share growth (CAGR)
8.27%
10-year dividend per share growth (CAGR)
7.92%
What the Analysts think about Waste Management
Analyst ratings (Buy, Hold, Sell) for Waste Management stock.
Waste Management Financial Performance
Revenues and expenses
Waste Management Earnings Performance
Company profitability
Waste Management News
AllArticlesVideos
Data displayed above is indicative only and its accuracy or completeness is not guaranteed. Actual execution price may vary. Past performance is not indicative of future results. Your return may be affected by currency fluctuations and applicable fees and charges. Capital at risk.
Real-time US market data is sourced from the IEX order book provided by Polygon. After-hours US market data is 15 minutes delayed and may differ significantly from the actual tradable price at market open.
Capital at risk
Upcoming events
No upcoming events
FAQs
What’s the current market cap for Waste Management stock?
Waste Management (WM) has a market cap of $93B as of February 22, 2026.
What is the P/E ratio for Waste Management stock?
The price to earnings (P/E) ratio for Waste Management (WM) stock is 34.37 as of February 22, 2026.
Does Waste Management stock pay dividends?
Yes, the Waste Management (WM) stock pays dividends to shareholders. As of February 22, 2026, the dividend rate is $3.3 and the yield is 1.43%. Waste Management has a payout ratio of 49.26% on a trailing twelve-month basis.
When is the next Waste Management dividend payment date?
The next Waste Management (WM) dividend payment date is unconfirmed.
What is the beta indicator for Waste Management?
Waste Management (WM) has a beta rating of 0.59. This means that it is less volatile than the market, on average. A beta of 1 would indicate the stock moves in-line with the market, while a beta of 0.5 would mean it moves half as much as the market.


