Zurn Elkay Water Solutions/$ZWS
1D1W1M3M6MYTD1Y5YMAX
Capital at risk
About Zurn Elkay Water Solutions
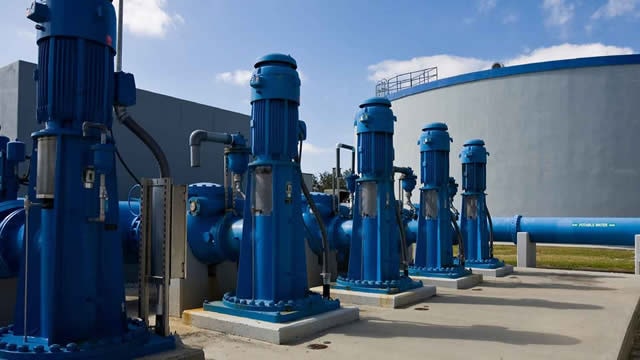
Zurn Elkay Water Solutions Corp is a growth-oriented, pure-play water management business that designs, procures, manufactures, and markets the broadest sustainable product portfolio of specification-driven water management solutions to improve health, hydration, human safety and the environment. Its product portfolio includes professional grade water safety and control products, flow systems products, hygienic and environmental products, and filtered drinking water products for public and private spaces that deliver superior value to building owners, positively impact the environment and human hygiene and reduce product installation time.
- Ticker
- $ZWS
- Sector
- Industrials
- Primary listing
- NYSE
- Employees
- 2,600
- Headquarters
- Milwaukee, United States
- Website
- www.zurnelkay.com
ZWS Metrics
BasicAdvanced
$7.4B
26.11
$1.72
0.83
$0.44
0.98%
Price and volume
Market cap
$7.4B
Beta
0.83
52-week high
$55.00
52-week low
$42.89
Average daily volume
990K
Dividend rate
$0.44
Financial strength
Current ratio
2.851
Quick ratio
1.847
Long term debt to equity
0.313
Total debt to equity
0.324
Dividend payout ratio (TTM)
25.29%
Interest coverage (TTM)
16.38%
Profitability
EBITDA (TTM)
497
Gross margin (TTM)
50.41%
Net profit margin (TTM)
15.91%
Operating margin (TTM)
22.51%
Effective tax rate (TTM)
24.45%
Revenue per employee (TTM)
$700,000
Management effectiveness
Return on assets (TTM)
9.36%
Return on equity (TTM)
17.61%
Valuation
Price to earnings (TTM)
26.112
Price to revenue (TTM)
4.101
Price to book
4.38
Price to tangible book (TTM)
748.41
Price to free cash flow (TTM)
19.353
Free cash flow yield (TTM)
5.17%
Free cash flow per share (TTM)
2.315
Dividend yield (TTM)
0.98%
Forward dividend yield
0.98%
Growth
Revenue change (TTM)
10.06%
Earnings per share change (TTM)
53.05%
3-year revenue growth (CAGR)
6.45%
3-year earnings per share growth (CAGR)
39.35%
3-year dividend per share growth (CAGR)
16.26%
What the Analysts think about ZWS
Analyst ratings (Buy, Hold, Sell) for Zurn Elkay Water Solutions stock.
Analyst projections of the future price of Zurn Elkay Water Solutions stock.
Bulls say / Bears say
Third-quarter core sales grew 7%, while adjusted EBITDA margin rose to 28.3% from 26.8% a year earlier. That points to continued demand and improving operating efficiency. (SEC)
Intellihot adds commercial tankless water heaters, and Zurn is extending its hot-water offering with digital mixing valves. These adjacencies could widen its addressable market and create new growth avenues. (Zurn Elkay, SEC)
The company generated $110 million of free cash flow in the third quarter and ended September with net debt leverage of just 0.4 times. That financial flexibility supports investment, share buybacks and a higher dividend. (SEC)
Management expects the served market to be down a couple of percentage points in 2027 and described residential as its weakest area. It also flagged delayed construction projects, which could weigh on sales. (Investing.com)
Growth may ease as last year’s tariff-related price increases roll off; management said second-half core growth reflects that comparison. Its fourth-quarter revenue outlook was also below analysts’ expectations. (Stock Analysis, Investing.com)
Intellihot expands Zurn’s market, but S&P expects it to have lower EBITDA margins than the existing business. Integrating the acquisition could therefore make it harder to sustain today’s high margins. (S&P Global Ratings)
Data summarised monthly by Lightyear AI. Last updated on 28 Oct 2026.
ZWS Financial Performance
Revenues and expenses
ZWS Earnings Performance
Company profitability
Upcoming events
ZWS News
AllArticlesVideos


Funds containing ZWS
AllUSDEURGBP
Fund name | Fund size | $ZWS weighting |
|---|---|---|
iShares Global Water£IH2O | $2.2B | 2.27% |
iShares Global Water€IQQQ | $2.1B | 2.27% |
L&G Clean Water$GLUG | $772M | 1.69% |
L&G Clean Water£GLGG | $772M | 1.69% |
iShares S&P SmallCap 600$IDP6 | $3.2B | 0.37% |
Data displayed above is indicative only and its accuracy or completeness is not guaranteed. Actual execution price may vary. Past performance is not indicative of future results. Your return may be affected by currency fluctuations and applicable fees and charges. Capital at risk.
Real-time US market data is sourced from the IEX order book provided by Polygon. After-hours US market data is 15 minutes delayed and may differ significantly from the actual tradable price at market open.