Cleveland-Cliffs/$CLF
1D1W1MYTD1Y5YMAX
Capital at risk
About Cleveland-Cliffs
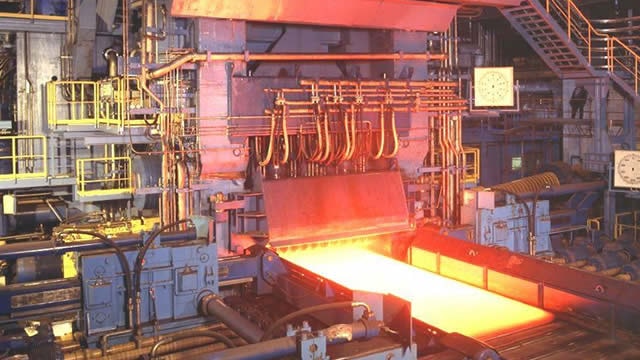
Cleveland-Cliffs Inc is a flat-rolled steel producer and manufacturer of iron ore pellets in North America. It is organized into four operating segments based on differentiated products, Steelmaking, Tubular, Tooling and Stamping and European Operations, but operates through one reportable segment -Steelmaking. It is vertically integrated from mined raw materials, direct reduced iron, and ferrous scrap to primary steelmaking and downstream finishing, stamping, tooling and tubing. It serves a diverse range of other markets due to its comprehensive offering of flat-rolled steel products. Geographically, it operates in the United States, Canada and other countries. The majority of revenue is from the United States. It is a supplier of steel to the automotive industry in North America.
- Ticker
- $CLF
- Sector
- Materials
- Primary listing
- NYSE
- Employees
- 25,000
- Headquarters
- Cleveland, United States
- Website
- www.clevelandcliffs.com
Cleveland-Cliffs Metrics
BasicAdvanced
$6.7B
-
-$1.60
2.14
-
Price and volume
Market cap
$6.7B
Beta
2.14
52-week high
$16.70
52-week low
$7.73
Average daily volume
14M
Financial strength
Current ratio
1.89
Quick ratio
0.586
Long term debt to equity
1.324
Total debt to equity
1.324
Interest coverage (TTM)
-0.91%
Profitability
EBITDA (TTM)
399
Gross margin (TTM)
-1.05%
Net profit margin (TTM)
-4.56%
Operating margin (TTM)
-2.89%
Effective tax rate (TTM)
31.90%
Revenue per employee (TTM)
$770,000
Management effectiveness
Return on assets (TTM)
-1.71%
Return on equity (TTM)
-13.86%
Valuation
Price to revenue (TTM)
0.336
Price to book
1.2
Price to tangible book (TTM)
2.44
Price to free cash flow (TTM)
-7.515
Free cash flow yield (TTM)
-13.31%
Free cash flow per share (TTM)
-1.569
Growth
Revenue change (TTM)
4.00%
Earnings per share change (TTM)
-53.45%
3-year revenue growth (CAGR)
-4.41%
10-year revenue growth (CAGR)
26.22%
3-year earnings per share growth (CAGR)
53.60%
10-year earnings per share growth (CAGR)
23.09%
What the Analysts think about Cleveland-Cliffs
Analyst ratings (Buy, Hold, Sell) for Cleveland-Cliffs stock.
Analyst projections of the future price of Cleveland-Cliffs stock.
Bulls say / Bears say
Adjusted EBITDA rose to $286 million in Q2 2026, up $191 million sequentially from Q1 2026 and the highest level in two years, demonstrating effective cost management and operational leverage. (SEC)
Liquidity remained strong at $3.1 billion as of June 30 2026, providing ample capital flexibility to fund strategic investments, capital expenditures and debt reduction. (SEC)
Steel shipments in Q1 2026 reached 4.1 million net tons, a sequential increase of 338,000 tons (8.9%), signaling robust demand and improved production throughput. (SEC)
GAAP net loss of $134 million in Q2 2026 underscores persistent profitability challenges despite sequential operational improvements. (SEC)
Adjusted net loss of $0.20 per diluted share in Q2 2026 reflects ongoing difficulty covering fixed costs even as operations recover. (SEC)
A one-time $80 million energy cost headwind in Q1 2026 reveals vulnerability to input price volatility and could recur amid unpredictable market conditions. (SEC)
Data summarised monthly by Lightyear AI. Last updated on 22 Aug 2026.
Cleveland-Cliffs Financial Performance
Revenues and expenses
Cleveland-Cliffs Earnings Performance
Company profitability
Upcoming events
No upcoming events
Cleveland-Cliffs News
AllArticlesVideos


Funds containing Cleveland-Cliffs
AllUSDGBPEUR
Fund name | Fund size | $CLF weighting |
|---|---|---|
SPDR S&P 400 US Mid Cap$SPY4 | $6.3B | 0.19% |
SPDR S&P 400 US Mid Cap£SPX4 | £4.7B | 0.19% |
iShares MSCI World Small Cap$WSML | $9B | 0.06% |
iShares MSCI World Small Cap€IUSN | €7.8B | 0.06% |
iShares MSCI World Small Cap£WLDS | £6.7B | 0.06% |
Data displayed above is indicative only and its accuracy or completeness is not guaranteed. Actual execution price may vary. Past performance is not indicative of future results. Your return may be affected by currency fluctuations and applicable fees and charges. Capital at risk.
Real-time US market data is sourced from the IEX order book provided by Polygon. After-hours US market data is 15 minutes delayed and may differ significantly from the actual tradable price at market open.