Ford Motor/$F
1D1W1M3M6MYTD1Y5YMAX
Capital at risk
About Ford Motor
Ford Motor Co. manufactures automobiles under its Ford and Lincoln brands. In 2022, the company announced that it would run its combustion engine business, Ford Blue, and its BEV business, Ford Model e, as separate businesses but still all under Ford Motor. The company has over 13% market share in the United States, about 10% share in the UK, and just over 1% share in China including Taiwan and unconsolidated affiliates. Sales in the US made up about 65% of 2025 total company revenue. Ford has about 169,000 employees, including about 56,300 UAW employees, and is based in Dearborn, Michigan.
- Ticker
- $F
- Sector
- Mobility
- Primary listing
- NYSE
- Employees
- 169,000
- Headquarters
- Dearborn, United States
- Website
- www.ford.com
Ford Motor Metrics
BasicAdvanced
$50B
-
-$1.97
1.91
$0.60
4.82%
Price and volume
Market cap
$50B
Beta
1.91
52-week high
$17.78
52-week low
$11.11
Average daily volume
43M
Dividend rate
$0.60
Financial strength
Current ratio
1.083
Quick ratio
0.891
Long term debt to equity
3.019
Total debt to equity
4.476
Interest coverage (TTM)
1.15%
Profitability
EBITDA (TTM)
7,569
Gross margin (TTM)
7.30%
Net profit margin (TTM)
-4.17%
Operating margin (TTM)
0.79%
Effective tax rate (TTM)
34.02%
Revenue per employee (TTM)
$1,110,000
Management effectiveness
Return on assets (TTM)
0.37%
Return on equity (TTM)
-18.43%
Valuation
Price to revenue (TTM)
0.265
Price to book
1.35
Price to tangible book (TTM)
1.35
Price to free cash flow (TTM)
9.643
Free cash flow yield (TTM)
10.37%
Free cash flow per share (TTM)
1.29
Dividend yield (TTM)
4.82%
Forward dividend yield
4.82%
Growth
Revenue change (TTM)
-1.38%
Earnings per share change (TTM)
-268.02%
3-year revenue growth (CAGR)
2.38%
10-year revenue growth (CAGR)
2.00%
3-year earnings per share growth (CAGR)
8.66%
10-year earnings per share growth (CAGR)
0.83%
What the Analysts think about Ford Motor
Analyst ratings (Buy, Hold, Sell) for Ford Motor stock.
Analyst projections of the future price of Ford Motor stock.
Bulls say / Bears say
Third-quarter adjusted EBIT rose 3% to $2.7 billion even as revenue fell 2%, and Ford lifted its 2026 EBIT outlook for a third time, to $10.5 billion–$11 billion. That points to better margins and cost control despite weaker sales. (Ford)
Ford’s software services and parts businesses both reported record revenue in the third quarter. Growth in these activities could make earnings less dependent on new vehicle sales. (Ford)
Ford ranked as the top mainstream brand in the latest JD Power initial-quality survey, an encouraging sign that its quality-repair efforts are gaining traction. Better quality could help reduce warranty costs and strengthen customer confidence. (Bloomberg)
Cox Automotive forecast Ford’s US sales would fall 8.8% through the first three quarters of 2026, cutting its market share by nearly a percentage point to 12.5%. Persistent share losses could weaken Ford’s scale and pricing power. (Reuters)
Ford reported a $1.33 billion net loss in the second quarter, including charges tied to unwinding its battery venture with SK On. The episode highlights the risk that costly changes to its electric-vehicle strategy will keep making earnings volatile. (Reuters)
A supplier problem halted production at Ford’s Dearborn truck plant for nearly a week and also disrupted shifts at another F-150 plant. Disruption to a key, high-volume model can limit deliveries and put pressure on earnings. (Reuters)
Data summarised monthly by Lightyear AI. Last updated on 4 Nov 2026.
Ford Motor Financial Performance
Revenues and expenses
Ford Motor Earnings Performance
Company profitability
Upcoming events
Ford Motor News
AllArticlesVideos

Where's the growth? Legacy automakers face a tougher 2027 as costs rise, market tightens
CNBC1 day ago

Wall Street's Most Accurate Analysts Spotlight On 3 Consumer Stocks Delivering High-Dividend Yields
Benzinga4 days ago
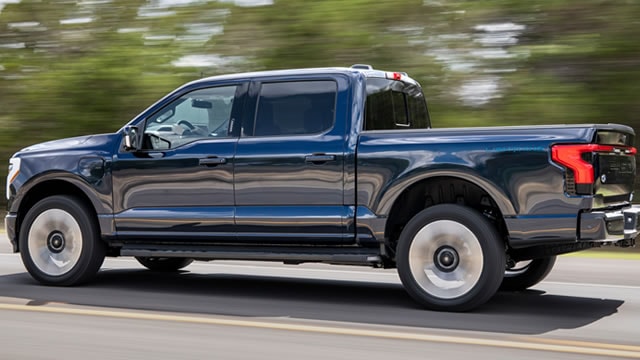
Ford launches a ‘privacy promise' and explains how and why it uses customer data
TechCrunch5 days ago
Funds containing Ford Motor
AllEURUSDGBP
Fund name | Fund size | $F weighting |
|---|---|---|
iShares Dow Jones U.S. Select Dividend€EXX5 | €412M | 1.40% |
iShares USD Short Duration Corporate Bond£IGSD | $1.8B | 1.03% |
iShares S&P 500 Consumer Discretionary Sector£ICDU | $788M | 1.02% |
iShares Edge MSCI World Value Factor$IWVL | $7.2B | 0.52% |
iShares Edge MSCI World Value Factor£IWFV | $7.2B | 0.52% |
Data displayed above is indicative only and its accuracy or completeness is not guaranteed. Actual execution price may vary. Past performance is not indicative of future results. Your return may be affected by currency fluctuations and applicable fees and charges. Capital at risk.
Real-time US market data is sourced from the IEX order book provided by Polygon. After-hours US market data is 15 minutes delayed and may differ significantly from the actual tradable price at market open.