Mondelez/$MDLZ
1D1W1MYTD1Y5YMAX
Capital at risk
About Mondelez
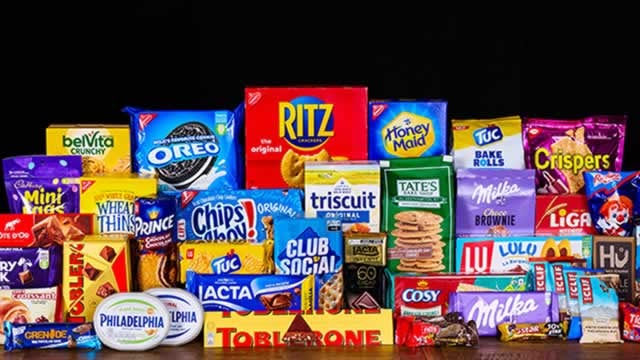
Mondelez has operated independently since its split from the former Kraft Foods North American grocery business in October 2012. Since that time, the firm has been a leading player in the global snack enclave with a presence in the biscuit (48% of sales as of the end of fiscal 2025), chocolate (33%), gum/candy (10%), beverage (3%), and cheese and grocery (6%) aisles. Mondelez's portfolio includes well-known brands like Oreo, Chips Ahoy, Halls, and Cadbury. The firm garners around one-third of its revenue from developing markets, around 40% from Europe, and more than one-fourth from North America.
- Ticker
- $MDLZ
- Sector
- Consumer Essentials
- Primary listing
- NASDAQ
- Employees
- 91,000
- Headquarters
- Chicago, United States
Mondelez Metrics
BasicAdvanced
$78B
22.30
$2.73
0.40
$2.00
3.29%
Price and volume
Market cap
$78B
Beta
0.4
52-week high
$66.65
52-week low
$51.20
Average daily volume
7.5M
Dividend rate
$2.00
Financial strength
Current ratio
0.599
Quick ratio
0.311
Long term debt to equity
0.639
Total debt to equity
0.826
Dividend payout ratio (TTM)
72.27%
Interest coverage (TTM)
7.97%
Profitability
EBITDA (TTM)
6,080
Gross margin (TTM)
31.15%
Net profit margin (TTM)
8.86%
Operating margin (TTM)
11.83%
Effective tax rate (TTM)
21.90%
Revenue per employee (TTM)
$440,000
Management effectiveness
Return on assets (TTM)
4.12%
Return on equity (TTM)
13.34%
Valuation
Price to earnings (TTM)
22.303
Price to revenue (TTM)
1.973
Price to book
2.93
Price to tangible book (TTM)
-4.57
Price to free cash flow (TTM)
25.38
Free cash flow yield (TTM)
3.94%
Free cash flow per share (TTM)
2.398
Dividend yield (TTM)
3.29%
Forward dividend yield
3.29%
Growth
Revenue change (TTM)
6.93%
Earnings per share change (TTM)
-0.74%
3-year revenue growth (CAGR)
5.15%
10-year revenue growth (CAGR)
3.94%
3-year earnings per share growth (CAGR)
-3.17%
10-year earnings per share growth (CAGR)
-5.33%
3-year dividend per share growth (CAGR)
9.10%
10-year dividend per share growth (CAGR)
11.39%
What the Analysts think about Mondelez
Analyst ratings (Buy, Hold, Sell) for Mondelez stock.
Analyst projections of the future price of Mondelez stock.
Bulls say / Bears say
Mondelez beat second-quarter revenue and profit expectations, with North American pricing up 2.2 percentage points and volumes up 1.2 points. It also raised its 2026 organic revenue-growth forecast to at least 2%, suggesting demand and execution are improving. (Reuters)
The company has a sizeable innovation runway beyond its existing brands. Management highlighted strong early results from Biscoff launches and a broad global Oreo relaunch planned for 2027, alongside expansion in cakes, pastries and snack bars. (StockAnalysis)
Cash generation and shareholder returns remain supportive of the equity case. Mondelez expects about $3 billion of 2026 free cash flow, returned $1.5 billion in the first half, and raised its quarterly dividend by 4%. (Mondelēz International)
Sales growth is not yet translating cleanly into earnings. Second-quarter adjusted EPS fell 2.7% in constant-currency terms, while full-year adjusted EPS guidance remains only flat to 5% growth. (Mondelēz International)
Europe remains a weak spot, with second-quarter organic sales down 3.5% as both pricing and volumes declined. That leaves the company reliant on stronger North American and emerging-market performance to offset regional weakness. (Grocery Gazette)
Cocoa remains a material risk to margins and forecasts: prices rose sharply from June as markets priced in a smaller surplus and possible El Niño disruption. Mondelez also flags commodity, trade and geopolitical volatility in its outlook, including extra costs linked to the Middle East conflict. (Rallies, Mondelēz International)
Data summarised monthly by Lightyear AI. Last updated on 21 Sept 2026.
Mondelez Financial Performance
Revenues and expenses
Mondelez Earnings Performance
Company profitability
Upcoming events
Mondelez News
AllArticlesVideos


Funds containing Mondelez
AllEURGBPUSD
Fund name | Fund size | $MDLZ weighting |
|---|---|---|
iShares S&P 500 Consumer Staples Sector€2B7D | €450M | 2.66% |
iShares S&P 500 Consumer Staples Sector£ICSU | £386M | 2.66% |
VanEck Morningstar Wide Moat€GMVM | €407M | 1.43% |
VanEck Morningstar Wide Moat£MOGB | £354M | 1.43% |
iShares Dow Jones U.S. Select Dividend€EXX5 | €412M | 1.22% |
Data displayed above is indicative only and its accuracy or completeness is not guaranteed. Actual execution price may vary. Past performance is not indicative of future results. Your return may be affected by currency fluctuations and applicable fees and charges. Capital at risk.
Real-time US market data is sourced from the IEX order book provided by Polygon. After-hours US market data is 15 minutes delayed and may differ significantly from the actual tradable price at market open.