Metallus/$MTUS
1D1W1MYTD1Y5YMAX
Capital at risk
About Metallus
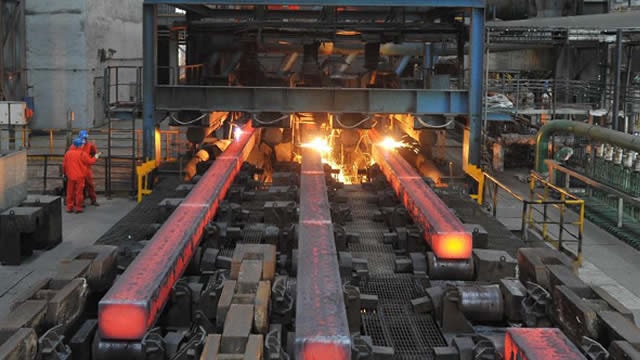
Metallus Inc is an American-based manufacturer of alloy steel, as well as carbon and micro-alloy steel. The portfolio of the company includes special bar quality steel, seamless mechanical tubes, and value-added solutions, such as precision steel components. The company also supplies machining and thermal treatment services and manages raw material recycling programs that work as a feeder system for its melt operations. The company's products and services are used in the following sectors: oil and gas; automotive, industrial equipment; mining; construction; rail; aerospace and defense; heavy truck; agriculture and power generation. Geographically, the company mainly serves customers in the United States.
- Ticker
- $MTUS
- Sector
- Materials
- Primary listing
- NYSE
- Employees
- 1,865
- Headquarters
- Canton, United States
- Website
- metallus.com
Metallus Metrics
BasicAdvanced
$797M
98.93
$0.19
1.37
-
Price and volume
Market cap
$797M
Beta
1.37
52-week high
$22.58
52-week low
$14.19
Average daily volume
368K
Financial strength
Current ratio
1.752
Quick ratio
0.831
Long term debt to equity
1.416
Total debt to equity
2.123
Interest coverage (TTM)
3.78%
Profitability
EBITDA (TTM)
62.7
Gross margin (TTM)
8.20%
Net profit margin (TTM)
0.66%
Operating margin (TTM)
0.56%
Effective tax rate (TTM)
21.36%
Revenue per employee (TTM)
$660,000
Management effectiveness
Return on assets (TTM)
0.38%
Return on equity (TTM)
1.17%
Valuation
Price to earnings (TTM)
98.932
Price to revenue (TTM)
0.655
Price to book
1.15
Price to tangible book (TTM)
1.16
Price to free cash flow (TTM)
-8.211
Free cash flow yield (TTM)
-12.18%
Free cash flow per share (TTM)
-2.343
Growth
Revenue change (TTM)
16.12%
Earnings per share change (TTM)
-136.03%
3-year revenue growth (CAGR)
-0.53%
10-year revenue growth (CAGR)
3.34%
3-year earnings per share growth (CAGR)
39.27%
10-year earnings per share growth (CAGR)
-15.04%
What the Analysts think about Metallus
Analyst ratings (Buy, Hold, Sell) for Metallus stock.
Analyst projections of the future price of Metallus stock.
Bulls say / Bears say
Metallus reported net sales of $341.0 million, up 12% year-over-year, and adjusted EBITDA of $29.0 million, a 9% increase compared to Q2 2025, reflecting strong operational performance. (SEC)
Management noted that strong order book levels provide healthy demand visibility for the second half of 2026, underscoring sustained traction across key end markets. (SEC)
On June 30, 2026, Metallus refinanced its asset-based revolving credit facility, extending the maturity to June 2031, which bolsters liquidity and financial flexibility. (PR Newswire)
Manufacturing cost performance declined sequentially due to lower fixed-cost absorption and higher maintenance expenses, highlighting execution challenges at downstream assets. (SEC)
Second quarter EPS of $0.21 missed the analyst consensus of $0.24, contributing to a 3.37% post-earnings stock decline on mixed market reaction. (Investing.com)
The company recorded $5 million of pension contributions in April 2026 and anticipates an additional $5 million in the second half of 2026, pressuring near-term free cash flow. (SEC)
Data summarised monthly by Lightyear AI. Last updated on 5 Sept 2026.
Metallus Financial Performance
Revenues and expenses
Metallus Earnings Performance
Company profitability
Upcoming events
No upcoming events
Metallus News
AllArticlesVideos
Funds containing Metallus
AllUSDGBPEUR
Fund name | Fund size | $MTUS weighting |
|---|---|---|
iShares S&P SmallCap 600$IDP6 | $3.2B | 0.04% |
iShares S&P Small Cap 600£ISP6 | £2.4B | 0.04% |
SPDR Russell 2000 US Small Cap€R2US | €4.8B | 0.03% |
iShares MSCI World Small Cap$WSML | $9B | 0.01% |
iShares MSCI World Small Cap€IUSN | €7.8B | 0.01% |
Data displayed above is indicative only and its accuracy or completeness is not guaranteed. Actual execution price may vary. Past performance is not indicative of future results. Your return may be affected by currency fluctuations and applicable fees and charges. Capital at risk.
Real-time US market data is sourced from the IEX order book provided by Polygon. After-hours US market data is 15 minutes delayed and may differ significantly from the actual tradable price at market open.