Wells Fargo/$WFC
1D1W1MYTD1Y5YMAX
Capital at risk
About Wells Fargo
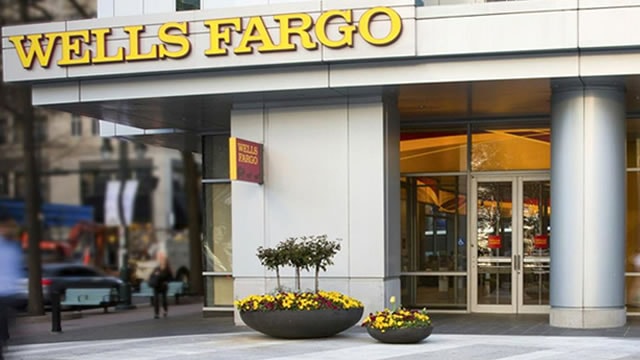
Wells Fargo is a premier, North American-focused banking titan that commands a $2.2 trillion balance sheet and the third-highest deposit market share in the United States. The bank uses a dense, expansive network of 4,093 branches to champion retail consumers and the middle market, where the firm has built a particularly strong reputation. Following the removal of its federal asset cap in 2025, the firm is set to deploy its legacy excess liquidity to expand each of its four segments: consumer & business lending, commercial banking, corporate & investment banking, and wealth & investment management.
- Ticker
- $WFC
- Sector
- Finance
- Primary listing
- NYSE
- Employees
- 197,466
- Headquarters
- San Francisco, United States
- Website
- www.wellsfargo.com
Wells Fargo Metrics
BasicAdvanced
$263B
12.63
$6.88
0.92
$1.85
2.30%
Price and volume
Market cap
$263B
Beta
0.92
52-week high
$97.76
52-week low
$72.78
Average daily volume
13M
Dividend rate
$1.85
Financial strength
Dividend payout ratio (TTM)
29.07%
Profitability
Net profit margin (TTM)
27.23%
Operating margin (TTM)
32.79%
Effective tax rate (TTM)
16.37%
Revenue per employee (TTM)
$420,000
Management effectiveness
Return on assets (TTM)
1.08%
Return on equity (TTM)
12.58%
Valuation
Price to earnings (TTM)
12.629
Price to revenue (TTM)
3.249
Price to book
1.6
Price to tangible book (TTM)
1.88
Price to free cash flow (TTM)
14.839
Free cash flow yield (TTM)
6.74%
Free cash flow per share (TTM)
5.856
Dividend yield (TTM)
2.13%
Forward dividend yield
2.30%
Growth
Revenue change (TTM)
6.97%
Earnings per share change (TTM)
18.11%
3-year revenue growth (CAGR)
2.90%
3-year earnings per share growth (CAGR)
18.99%
10-year earnings per share growth (CAGR)
5.44%
3-year dividend per share growth (CAGR)
14.47%
10-year dividend per share growth (CAGR)
1.81%
What the Analysts think about Wells Fargo
Analyst ratings (Buy, Hold, Sell) for Wells Fargo stock.
Analyst projections of the future price of Wells Fargo stock.
Bulls say / Bears say
With the asset cap gone and the final consent order removed, Wells Fargo can now pursue growth across lending and deposits. Management expects 2026 loan growth to beat its earlier mid-single-digit forecast, after average loans rose about 12% year on year in the second quarter. (Reuters, StockAnalysis)
Second-quarter growth was broad rather than dependent on one business. Revenue rose 9%, non-interest income rose 13%, wealth revenue rose 13% and corporate and investment banking revenue rose 16%, giving Wells Fargo several fee-generating routes to offset slower lending income. (Last10K)
The bank is showing operating leverage while investing for growth: second-quarter expenses rose only 2%, return on tangible common equity reached 17.7% and headcount fell 7% year on year. It also repurchased about $7 billion of shares in the first half, supporting per-share returns if earnings remain strong. (MarketScreener)
Loan and deposit growth is not translating cleanly into margins. Investors have noted slight net interest margin compression, while Wells Fargo is adding lower-margin markets activity and maintaining 2026 net interest income guidance rather than raising it. (MarketScreener, American Banker)
Part of the recent earnings strength came from trading and investment banking, including a 24% rise in markets revenue and a 64% jump in equities trading revenue. Those businesses depend on market volatility and deal activity, so a quieter market could make fee growth less consistent. (MarketScreener)
Credit quality is currently good, but faster expansion increases the amount at risk in consumer lending. Average loans rose 12% year on year, consumer charge-offs were still 0.74% annualised and auto losses increased, leaving Wells Fargo more exposed if household conditions weaken. (Last10K, Reuters)
Data summarised monthly by Lightyear AI. Last updated on 18 Sept 2026.
Wells Fargo Financial Performance
Revenues and expenses
Wells Fargo Earnings Performance
Company profitability
Upcoming events
No upcoming events
Wells Fargo News
AllArticlesVideos


Funds containing Wells Fargo
AllEURGBPUSD
Fund name | Fund size | $WFC weighting |
|---|---|---|
iShares S&P US Banks€IUS2 | €1B | 7.43% |
VanEck Quantum Computing€QUTM | €199M | 4.40% |
Vaneck Quantum Computing£QNTG | £172M | 4.40% |
iShares S&P 500 Financials Sector$IUFS | $2.4B | 3.37% |
iShares S&P 500 Financials Sector£UIFS | £1.8B | 3.37% |
Data displayed above is indicative only and its accuracy or completeness is not guaranteed. Actual execution price may vary. Past performance is not indicative of future results. Your return may be affected by currency fluctuations and applicable fees and charges. Capital at risk.
Real-time US market data is sourced from the IEX order book provided by Polygon. After-hours US market data is 15 minutes delayed and may differ significantly from the actual tradable price at market open.