ATI Inc/$ATI
1D1W1MYTD1Y5YMAX
Capital at risk
About ATI Inc
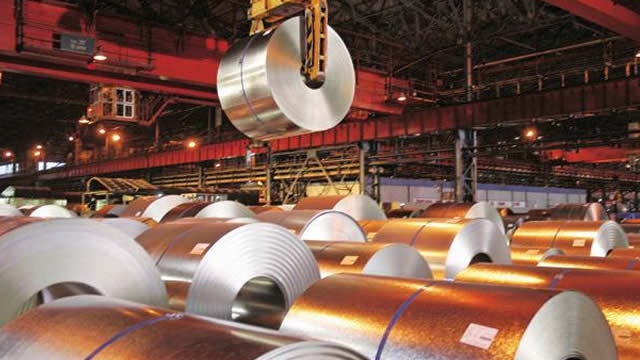
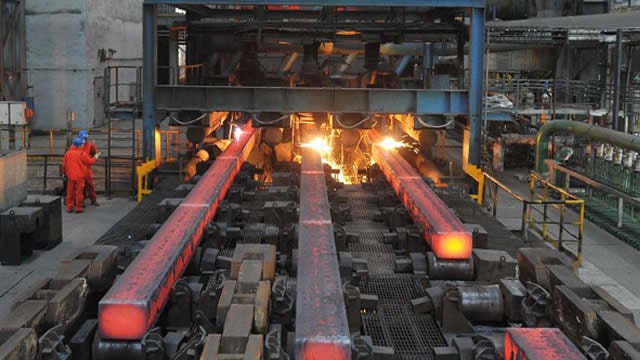
ATI Inc supplies specialty metals to various end markets, including aerospace and defense, oil and gas, automotive, and electrical energy, among many others. The company's operating segment includes High-Performance Materials and Components and Advanced Alloys and Solutions. The majority of revenue is from the High-Performance Materials segment. The High-Performance Materials segment is focused on a wide range of high-performance specialty materials, parts, and components for several the majority of end markets, including the aerospace & defense, medical, and energy markets. Geographically, it operates in the United States, China, the United Kingdom, Germany, France, Canada, and Others, the majority is from the United States.
- Ticker
- $ATI
- Sector
- Industrials
- Primary listing
- NYSE
- Employees
- 7,600
- Headquarters
- Dallas, United States
- Website
- www.atimaterials.com
ATI Inc Metrics
BasicAdvanced
$25B
54.63
$3.41
1.01
-
Price and volume
Market cap
$25B
Beta
1.01
52-week high
$243.57
52-week low
$75.02
Average daily volume
1.8M
Financial strength
Current ratio
2.327
Quick ratio
1.082
Long term debt to equity
0.905
Total debt to equity
1.097
Interest coverage (TTM)
7.01%
Profitability
EBITDA (TTM)
931.1
Gross margin (TTM)
23.65%
Net profit margin (TTM)
10.09%
Operating margin (TTM)
16.35%
Effective tax rate (TTM)
18.11%
Revenue per employee (TTM)
$620,000
Management effectiveness
Return on assets (TTM)
8.79%
Return on equity (TTM)
25.36%
Valuation
Price to earnings (TTM)
54.625
Price to revenue (TTM)
5.391
Price to book
13.51
Price to tangible book (TTM)
15.35
Price to free cash flow (TTM)
48.295
Free cash flow yield (TTM)
2.07%
Free cash flow per share (TTM)
3.856
Growth
Revenue change (TTM)
4.58%
Earnings per share change (TTM)
17.77%
3-year revenue growth (CAGR)
4.55%
10-year revenue growth (CAGR)
4.15%
3-year earnings per share growth (CAGR)
2.04%
10-year earnings per share growth (CAGR)
-2.91%
What the Analysts think about ATI Inc
Analyst ratings (Buy, Hold, Sell) for ATI Inc stock.
Analyst projections of the future price of ATI Inc stock.
Bulls say / Bears say
ATI’s second-quarter revenue rose 11% year-over-year to $1.26 billion, surpassing consensus estimates amid strong aerospace and defense demand (TradingView News) (tradingview.com)
Adjusted EPS of $1.23 for Q2 2026 topped analyst forecasts of approximately $1.02, marking a 20% beat and reflecting operational leverage and pricing improvements (TradingView News) (tradingview.com)
Record order backlog of $4.4 billion at the end of Q2, up 18% year-over-year, provides strong multi-year revenue visibility and underpins raised full-year guidance (Investing.com) (investing.com)
Intensifying competition from Chinese titanium suppliers courting aerospace customers at events like the 2026 Farnborough Airshow could erode ATI’s market share and pricing power in key end markets (Reuters) (m.investing.com)
Ongoing pension de-risking litigation, despite ATI’s recent victory in dismissing a lawsuit over annuity buyouts, underscores potential legal challenges and pension funding liabilities that could resurface in future appeals (Bloomberg Law) (news.bloomberglaw.com)
Data summarised monthly by Lightyear AI. Last updated on 2 Sept 2026.
ATI Inc Financial Performance
Revenues and expenses
ATI Inc Earnings Performance
Company profitability
Upcoming events
No upcoming events
ATI Inc News
AllArticlesVideos

Funds containing ATI Inc
AllEURGBPUSD
Fund name | Fund size | $ATI weighting |
|---|---|---|
iShares Global Aerospace & Defence€DFND | €1.6B | 1.20% |
iShares Global Aerospace & Defence£DFND | £1.4B | 1.20% |
SPDR S&P 400 US Mid Cap$SPY4 | $6.3B | 0.73% |
SPDR S&P 400 US Mid Cap£SPX4 | £4.7B | 0.73% |
SPDR MSCI World Industrials€WIND | €217M | 0.23% |
Data displayed above is indicative only and its accuracy or completeness is not guaranteed. Actual execution price may vary. Past performance is not indicative of future results. Your return may be affected by currency fluctuations and applicable fees and charges. Capital at risk.
Real-time US market data is sourced from the IEX order book provided by Polygon. After-hours US market data is 15 minutes delayed and may differ significantly from the actual tradable price at market open.