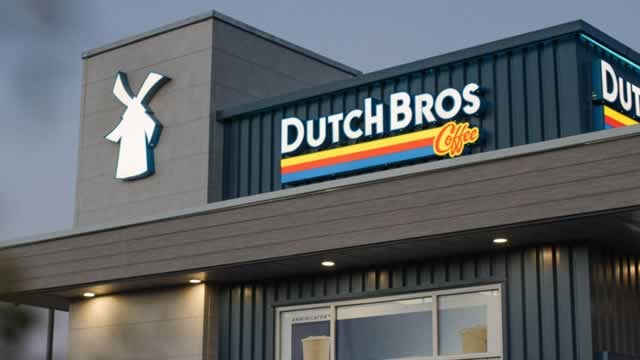
Dutch Bros/$BROS
14:30
16:10
17:45
19:25
21:00
1D1W1MYTD1Y5YMAX
About Dutch Bros
Dutch Bros Inc is an operator and franchisor of drive-thru coffee shops that are focused on serving hand-crafted beverages. The company's hand-crafted beverage-focused lineup features hot and cold espresso-based beverages, cold brew coffee products, proprietary energy drinks, tea, lemonade, smoothies and other beverages. The company has two reportable operating segments Company-operated shops and Franchising. It derives maximum revenue from Company operated shops.
Ticker
$BROS
Sector
Primary listing
NYSE
Employees
21,000
Headquarters
Website
Dutch Bros Metrics
BasicAdvanced
$7.8B
120.81
$0.51
2.57
-
Price and volume
Market cap
$7.8B
Beta
2.57
52-week high
$86.88
52-week low
$47.16
Average daily volume
3.8M
Financial strength
Current ratio
1.52
Quick ratio
1.257
Long term debt to equity
115.615
Total debt to equity
119.831
Interest coverage (TTM)
5.53%
Profitability
EBITDA (TTM)
261.916
Gross margin (TTM)
26.33%
Net profit margin (TTM)
4.04%
Operating margin (TTM)
9.95%
Effective tax rate (TTM)
15.60%
Revenue per employee (TTM)
$70,000
Management effectiveness
Return on assets (TTM)
3.57%
Return on equity (TTM)
11.68%
Valuation
Price to earnings (TTM)
120.806
Price to revenue (TTM)
4.86
Price to book
11.83
Price to tangible book (TTM)
12.26
Price to free cash flow (TTM)
132.47
Free cash flow yield (TTM)
0.75%
Free cash flow per share (TTM)
0.461
Growth
Revenue change (TTM)
28.93%
Earnings per share change (TTM)
56.73%
3-year revenue growth (CAGR)
31.42%
3-year earnings per share growth (CAGR)
61.91%
What the Analysts think about Dutch Bros
Analyst ratings (Buy, Hold, Sell) for Dutch Bros stock.
Dutch Bros Financial Performance
Revenues and expenses
Dutch Bros Earnings Performance
Company profitability
Dutch Bros News
AllArticlesVideos
Data displayed above is indicative only and its accuracy or completeness is not guaranteed. Actual execution price may vary. Past performance is not indicative of future results. Your return may be affected by currency fluctuations and applicable fees and charges. Capital at risk.
Real-time US market data is sourced from the IEX order book provided by Polygon. After-hours US market data is 15 minutes delayed and may differ significantly from the actual tradable price at market open.
Capital at risk
Upcoming events
No upcoming events
FAQs
What’s the current market cap for Dutch Bros stock?
Dutch Bros (BROS) has a market cap of $7.8B as of December 13, 2025.
What is the P/E ratio for Dutch Bros stock?
The price to earnings (P/E) ratio for Dutch Bros (BROS) stock is 120.81 as of December 13, 2025.
Does Dutch Bros stock pay dividends?
No, Dutch Bros (BROS) stock does not pay dividends to its shareholders as of December 13, 2025.
When is the next Dutch Bros dividend payment date?
Dutch Bros (BROS) stock does not pay dividends to its shareholders.
What is the beta indicator for Dutch Bros?
Dutch Bros (BROS) has a beta rating of 2.57. This means that it is more volatile than the market, on average. A beta of 1 would indicate the stock moves in-line with the market, while a beta of 2 would indicate the stock moves twice as much as the market.


