CSX/$CSX
1D1W1MYTD1Y5YMAX
Capital at risk
About CSX
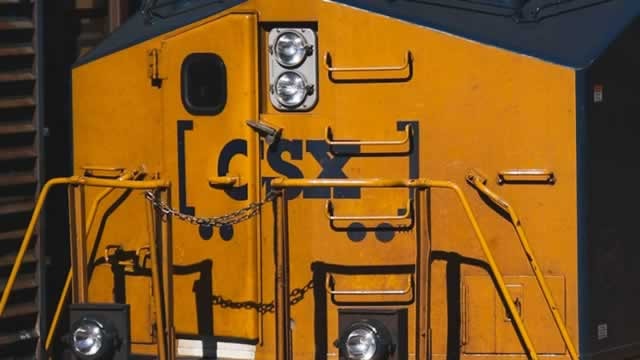
Operating in the Eastern United States, Class I railroad CSX generated revenue of nearly $14 billion in 2025. On its more than 21,000 miles of track, CSX hauls shipments of coal (16% of consolidated revenue), chemicals (17%), intermodal containers (16%), automotive cargo (7%), and a diverse mix of other bulk and industrial merchandise.
- Ticker
- $CSX
- Sector
- Mobility
- Primary listing
- NASDAQ
- Employees
- 22,200
- Headquarters
- Jacksonville, United States
- Website
- www.csx.com
CSX Metrics
BasicAdvanced
$87B
27.23
$1.73
1.21
$0.55
1.19%
Price and volume
Market cap
$87B
Beta
1.21
52-week high
$53.60
52-week low
$32.84
Average daily volume
9.6M
Dividend rate
$0.55
Financial strength
Current ratio
0.82
Quick ratio
0.685
Long term debt to equity
1.26
Total debt to equity
1.381
Dividend payout ratio (TTM)
31.15%
Interest coverage (TTM)
6.11%
Profitability
EBITDA (TTM)
6,831
Gross margin (TTM)
47.07%
Net profit margin (TTM)
22.21%
Operating margin (TTM)
35.67%
Effective tax rate (TTM)
23.28%
Revenue per employee (TTM)
$650,000
Management effectiveness
Return on assets (TTM)
7.38%
Return on equity (TTM)
24.36%
Valuation
Price to earnings (TTM)
27.231
Price to revenue (TTM)
6.037
Price to book
6.2
Price to tangible book (TTM)
6.31
Price to free cash flow (TTM)
31.333
Free cash flow yield (TTM)
3.19%
Free cash flow per share (TTM)
1.503
Dividend yield (TTM)
1.17%
Forward dividend yield
1.19%
Growth
Revenue change (TTM)
2.52%
Earnings per share change (TTM)
6.09%
3-year revenue growth (CAGR)
-1.16%
10-year revenue growth (CAGR)
2.77%
3-year earnings per share growth (CAGR)
-4.28%
10-year earnings per share growth (CAGR)
10.97%
3-year dividend per share growth (CAGR)
8.74%
10-year dividend per share growth (CAGR)
8.45%
What the Analysts think about CSX
Analyst ratings (Buy, Hold, Sell) for CSX stock.
Analyst projections of the future price of CSX stock.
Bulls say / Bears say
CSX reported record Q2 2026 revenue of $3.94 billion, up 10% year-over-year, and diluted EPS of $0.54, up 23%, driven by 6% volume growth led by a 9% increase in intermodal shipments. (Reuters)
Operating margin expanded 240 basis points year-over-year to 38.3% in Q2 2026, reflecting significant productivity gains and cost efficiencies. (CSX)
On May 12, 2026, CSX’s Board approved an incremental $5 billion share repurchase program, leaving $5.7 billion in repurchase authority as of June 30, 2026, underscoring management’s commitment to shareholder returns and EPS support. (CSX 10-Q)
Non-intermodal markets remain under pressure as CSX continues to navigate a prolonged downturn in coal traffic and weaker industrial freight demand, limiting growth outside of intermodal. (Reuters)
Export coal shipments decreased by 1% in Q1 2026 due to weather-related disruptions and lower benchmark rates, underscoring the volatility risk in its coal segment, which represents roughly 16% of revenue. (CSX Press Release) and (CSX Q1 10-Q)
Data summarised monthly by Lightyear AI. Last updated on 1 Sept 2026.
CSX Financial Performance
Revenues and expenses
CSX Earnings Performance
Company profitability
Upcoming events
No upcoming events
CSX News
AllArticlesVideos


Funds containing CSX
AllEURGBPUSD
Fund name | Fund size | $CSX weighting |
|---|---|---|
iShares Global Infrastructure€INFR | €2.1B | 2.77% |
iShares S&P 500 Industrials Sector€2B7C | €673M | 1.67% |
iShares S&P 500 Industrials Sector£IISU | £578M | 1.67% |
SPDR MSCI World Industrials€WIND | €217M | 0.90% |
SPDR S&P US Dividend Aristocrats€SPYD | €3.3B | 0.50% |
Data displayed above is indicative only and its accuracy or completeness is not guaranteed. Actual execution price may vary. Past performance is not indicative of future results. Your return may be affected by currency fluctuations and applicable fees and charges. Capital at risk.
Real-time US market data is sourced from the IEX order book provided by Polygon. After-hours US market data is 15 minutes delayed and may differ significantly from the actual tradable price at market open.