Dollar Tree/$DLTR
1D1W1MYTD1Y5YMAX
Capital at risk
About Dollar Tree
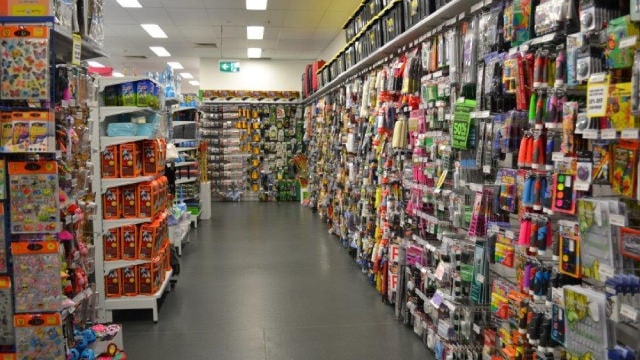
Founded in 1986, Dollar Tree operates almost 9,000 small-box discount stores across the United States and Canada, offering roughly 85% of its merchandise under $2. The chain targets value-conscious suburban and urban shoppers with a mix of consumables (49% of sales), variety (45%), and seasonal goods (6%). In fiscal 2025, Dollar Tree generated over $19 billion in sales through its multi-price strategy, higher-margin discretionary assortments, and private-label products that account for nearly one-third of sales.
- Ticker
- $DLTR
- Sector
- Consumer Essentials
- Primary listing
- NASDAQ
- Employees
- 150,000
- Headquarters
- Chesapeake, United States
- Website
- www.dollartree.com
Dollar Tree Metrics
BasicAdvanced
$21B
14.04
$8.15
0.66
-
Price and volume
Market cap
$21B
Beta
0.66
52-week high
$142.40
52-week low
$84.71
Average daily volume
2.9M
Financial strength
Current ratio
1.134
Quick ratio
0.32
Long term debt to equity
1.944
Total debt to equity
2.239
Interest coverage (TTM)
24.45%
Profitability
EBITDA (TTM)
2,503.8
Gross margin (TTM)
37.18%
Net profit margin (TTM)
8.03%
Operating margin (TTM)
9.03%
Effective tax rate (TTM)
24.62%
Revenue per employee (TTM)
$130,000
Management effectiveness
Return on assets (TTM)
8.26%
Return on equity (TTM)
46.03%
Valuation
Price to earnings (TTM)
14.037
Price to revenue (TTM)
1.126
Price to book
6.27
Price to tangible book (TTM)
7.15
Price to free cash flow (TTM)
11.422
Free cash flow yield (TTM)
8.75%
Free cash flow per share (TTM)
10.018
Growth
Revenue change (TTM)
8.18%
Earnings per share change (TTM)
-159.16%
3-year revenue growth (CAGR)
-11.86%
10-year revenue growth (CAGR)
-0.16%
3-year earnings per share growth (CAGR)
14.03%
10-year earnings per share growth (CAGR)
10.46%
What the Analysts think about Dollar Tree
Analyst ratings (Buy, Hold, Sell) for Dollar Tree stock.
Analyst projections of the future price of Dollar Tree stock.
Bulls say / Bears say
Dollar Tree’s second-quarter sales rose 7% and comparable sales rose 3.7%, with traffic turning positive at 0.4%. Management also raised full-year adjusted EPS guidance to $7.70–$8.05, suggesting the recovery is gaining traction. (Dollar Tree, Reuters)
The multi-price rollout is expanding the basket without abandoning Dollar Tree’s value proposition. About 6,600 stores had the format by the second quarter, while the company opened 75 stores and plans roughly 400 openings for the year. (Dollar Tree)
The latest margin improvement was not entirely a tariff windfall. Of the 850-basis-point gross-margin increase, 680 points came from tariff-related items, with the remainder mainly reflecting better shrink, lower freight costs and occupancy leverage; underlying adjusted EPS still beat the company’s prior outlook after stripping out tariff effects. (Dollar Tree, TIKR)
The near-term profit outlook is weaker than the headline quarter suggests. Dollar Tree forecast third-quarter adjusted EPS of just $0.80–$0.95, below expectations, as tariff-refund reinvestment and higher fuel-driven freight costs pressure earnings. (Reuters, Dollar Tree)
A large part of the earnings surge is temporary. The second quarter included $383 million of tariff refunds, and the full-year EPS outlook includes about a $0.60 benefit from them, leaving future results more exposed if tariff relief fades. (Dollar Tree)
The traffic recovery remains fragile because most comparable-sales growth came from higher average tickets rather than more shoppers. After selling Family Dollar, Dollar Tree also acknowledges that its smaller standalone profile may be more vulnerable to market changes and that the expected benefits of the sale may not fully materialise. (Reuters, Dollar Tree)
Data summarised monthly by Lightyear AI. Last updated on 16 Sept 2026.
Dollar Tree Financial Performance
Revenues and expenses
Dollar Tree Earnings Performance
Company profitability
Upcoming events
No upcoming events
Dollar Tree News
AllArticlesVideos

Funds containing Dollar Tree
AllEURGBPUSD
Fund name | Fund size | $DLTR weighting |
|---|---|---|
iShares S&P 500 Consumer Staples Sector€2B7D | €450M | 0.76% |
iShares S&P 500 Consumer Staples Sector£ICSU | £386M | 0.76% |
iShares S&P 500 Equal Weight€O4J0 | €4.3B | 0.20% |
iShares S&P 500 Equal Weight£EWSP | £3.7B | 0.20% |
Amundi MSCI World ESG Broad Transition€LWCR | €1.1B | 0.09% |
Data displayed above is indicative only and its accuracy or completeness is not guaranteed. Actual execution price may vary. Past performance is not indicative of future results. Your return may be affected by currency fluctuations and applicable fees and charges. Capital at risk.
Real-time US market data is sourced from the IEX order book provided by Polygon. After-hours US market data is 15 minutes delayed and may differ significantly from the actual tradable price at market open.