EOG Resources/$EOG
14:30
16:10
17:45
19:25
21:00
1D1W1MYTD1Y5YMAX
About EOG Resources
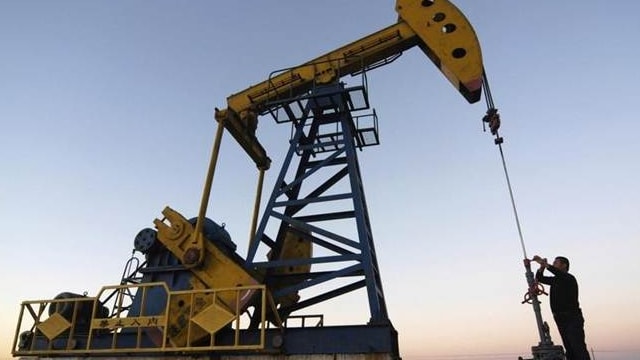
EOG Resources is an oil and gas producer with acreage in several US shale plays, primarily in the Permian Basin and the Eagle Ford. At the end of 2024, it reported net proven reserves of 4.7 billion barrels of oil equivalent. Net production averaged roughly 1,062 thousand barrels of oil equivalent per day in 2024 at a ratio of 69% oil and natural gas liquids and 31% natural gas.
Ticker
$EOG
Sector
Primary listing
NYSE
Employees
3,150
Headquarters
Website
EOG Resources Metrics
BasicAdvanced
$56B
10.30
$10.05
0.50
$3.95
3.94%
Price and volume
Market cap
$56B
Beta
0.5
52-week high
$138.18
52-week low
$101.59
Average daily volume
3.7M
Dividend rate
$3.95
Financial strength
Current ratio
1.624
Quick ratio
1.29
Long term debt to equity
25.316
Total debt to equity
26.835
Dividend payout ratio (TTM)
38.34%
Interest coverage (TTM)
34.54%
Profitability
EBITDA (TTM)
11,760
Gross margin (TTM)
62.29%
Net profit margin (TTM)
24.41%
Operating margin (TTM)
31.56%
Effective tax rate (TTM)
21.85%
Revenue per employee (TTM)
$7,190,000
Management effectiveness
Return on assets (TTM)
9.09%
Return on equity (TTM)
18.48%
Valuation
Price to earnings (TTM)
10.299
Price to revenue (TTM)
2.504
Price to book
1.86
Price to tangible book (TTM)
1.86
Price to free cash flow (TTM)
14.577
Free cash flow yield (TTM)
6.86%
Free cash flow per share (TTM)
7.1
Dividend yield (TTM)
3.81%
Forward dividend yield
3.94%
Growth
Revenue change (TTM)
-5.07%
Earnings per share change (TTM)
-18.93%
3-year revenue growth (CAGR)
-7.94%
10-year revenue growth (CAGR)
8.13%
3-year earnings per share growth (CAGR)
-7.60%
10-year earnings per share growth (CAGR)
3.74%
3-year dividend per share growth (CAGR)
9.56%
10-year dividend per share growth (CAGR)
19.40%
What the Analysts think about EOG Resources
Analyst ratings (Buy, Hold, Sell) for EOG Resources stock.
EOG Resources Financial Performance
Revenues and expenses
EOG Resources Earnings Performance
Company profitability
EOG Resources News
AllArticlesVideos
Data displayed above is indicative only and its accuracy or completeness is not guaranteed. Actual execution price may vary. Past performance is not indicative of future results. Your return may be affected by currency fluctuations and applicable fees and charges. Capital at risk.
Real-time US market data is sourced from the IEX order book provided by Polygon. After-hours US market data is 15 minutes delayed and may differ significantly from the actual tradable price at market open.
Capital at risk
Upcoming events
FAQs
What’s the current market cap for EOG Resources stock?
EOG Resources (EOG) has a market cap of $56B as of December 29, 2025.
What is the P/E ratio for EOG Resources stock?
The price to earnings (P/E) ratio for EOG Resources (EOG) stock is 10.3 as of December 29, 2025.
Does EOG Resources stock pay dividends?
Yes, the EOG Resources (EOG) stock pays dividends to shareholders. As of December 29, 2025, the dividend rate is $3.945 and the yield is 3.94%. EOG Resources has a payout ratio of 38.34% on a trailing twelve-month basis.
When is the next EOG Resources dividend payment date?
The next EOG Resources (EOG) dividend payment is scheduled for January 30, 2026.
What is the beta indicator for EOG Resources?
EOG Resources (EOG) has a beta rating of 0.5. This means that it is less volatile than the market, on average. A beta of 1 would indicate the stock moves in-line with the market, while a beta of 0.5 would mean it moves half as much as the market.

