Equinor/$EQNR
14:30
16:10
17:45
19:25
21:00
1D1W1MYTD1Y5YMAX
About Equinor
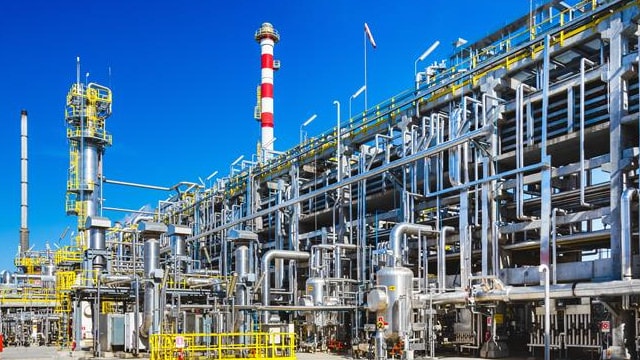
Equinor is a Norway-based integrated oil and gas company. It has been publicly listed since 2001, but the government retains a 67% stake. Operating primarily on the Norwegian Continental Shelf, the firm produced 2.1 million barrels of oil equivalent per day in 2024 (52% liquids) and ended 2024 with 6.1 billion barrels of proven reserves (42% liquids). Operations also include offshore wind, solar, oil refineries and natural gas processing, marketing, and trading.
Ticker
$EQNR
Sector
Primary listing
NYSE
Employees
24,384
Headquarters
Stavanger, Norway
Website
Equinor Metrics
BasicAdvanced
$57B
10.66
$2.15
-0.04
$1.50
5.31%
Price and volume
Market cap
$57B
Beta
-0.04
52-week high
$28.27
52-week low
$21.41
Average daily volume
3.7M
Dividend rate
$1.50
Financial strength
Current ratio
1.481
Quick ratio
0.93
Long term debt to equity
61.762
Total debt to equity
76.255
Dividend payout ratio (TTM)
76.87%
Interest coverage (TTM)
52.29%
Profitability
EBITDA (TTM)
37,007
Gross margin (TTM)
38.13%
Net profit margin (TTM)
5.35%
Operating margin (TTM)
26.47%
Effective tax rate (TTM)
79.12%
Revenue per employee (TTM)
$4,390,000
Management effectiveness
Return on assets (TTM)
13.07%
Return on equity (TTM)
13.52%
Valuation
Price to earnings (TTM)
10.664
Price to revenue (TTM)
0.566
Price to book
14.49
Price to tangible book (TTM)
17.22
Price to free cash flow (TTM)
8.617
Free cash flow yield (TTM)
11.60%
Free cash flow per share (TTM)
2.655
Dividend yield (TTM)
6.54%
Forward dividend yield
5.31%
Growth
Revenue change (TTM)
2.15%
Earnings per share change (TTM)
-34.46%
3-year revenue growth (CAGR)
-10.09%
10-year revenue growth (CAGR)
5.56%
3-year earnings per share growth (CAGR)
-34.22%
10-year earnings per share growth (CAGR)
2.93%
3-year dividend per share growth (CAGR)
22.76%
10-year dividend per share growth (CAGR)
21.51%
What the Analysts think about Equinor
Analyst ratings (Buy, Hold, Sell) for Equinor stock.
Equinor Financial Performance
Revenues and expenses
Equinor Earnings Performance
Company profitability
Equinor News
AllArticlesVideos
Data displayed above is indicative only and its accuracy or completeness is not guaranteed. Actual execution price may vary. Past performance is not indicative of future results. Your return may be affected by currency fluctuations and applicable fees and charges. Capital at risk.
Real-time US market data is sourced from the IEX order book provided by Polygon. After-hours US market data is 15 minutes delayed and may differ significantly from the actual tradable price at market open.
Capital at risk
Upcoming events
No upcoming events
FAQs
What’s the current market cap for Equinor stock?
Equinor (EQNR) has a market cap of $57B as of December 17, 2025.
What is the P/E ratio for Equinor stock?
The price to earnings (P/E) ratio for Equinor (EQNR) stock is 10.66 as of December 17, 2025.
Does Equinor stock pay dividends?
Yes, the Equinor (EQNR) stock pays dividends to shareholders. As of December 17, 2025, the dividend rate is $1.4965 and the yield is 5.31%. Equinor has a payout ratio of 76.87% on a trailing twelve-month basis.
When is the next Equinor dividend payment date?
The next Equinor (EQNR) dividend payment date is unconfirmed.
What is the beta indicator for Equinor?
Equinor (EQNR) has a beta rating of -0.04. This means that it has an inverse relation to market volatility.


