Metallus/$MTUS
1D1W1MYTD1Y5YMAX
Capital at risk
About Metallus
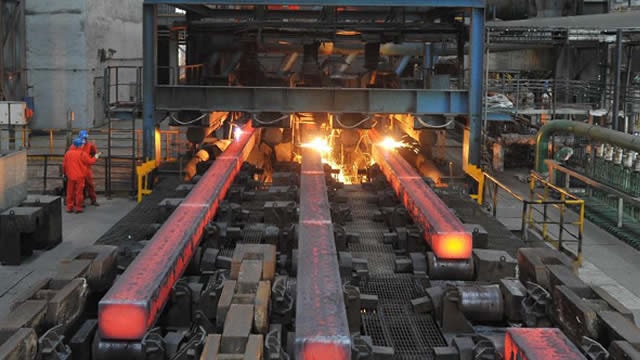
Metallus Inc is an American-based manufacturer of alloy steel, as well as carbon and micro-alloy steel. The portfolio of the company includes special bar quality steel, seamless mechanical tubes, and value-added solutions, such as precision steel components. The company also supplies machining and thermal treatment services and manages raw material recycling programs that work as a feeder system for its melt operations. The company's products and services are used in the following sectors: oil and gas; automotive, industrial equipment; mining; construction; rail; aerospace and defense; heavy truck; agriculture and power generation. Geographically, the company mainly serves customers in the United States.
- Ticker
- $MTUS
- Sector
- Materials
- Primary listing
- NYSE
- Employees
- 1,865
- Headquarters
- Canton, United States
- Website
- metallus.com
Metallus Metrics
BasicAdvanced
$805M
99.86
$0.19
1.37
-
Price and volume
Market cap
$805M
Beta
1.37
52-week high
$22.58
52-week low
$14.19
Average daily volume
334K
Financial strength
Current ratio
1.752
Quick ratio
0.831
Long term debt to equity
0.014
Total debt to equity
0.021
Interest coverage (TTM)
3.78%
Profitability
EBITDA (TTM)
65.9
Gross margin (TTM)
8.20%
Net profit margin (TTM)
0.66%
Operating margin (TTM)
0.82%
Effective tax rate (TTM)
21.36%
Revenue per employee (TTM)
$660,000
Management effectiveness
Return on assets (TTM)
0.55%
Return on equity (TTM)
1.17%
Valuation
Price to earnings (TTM)
99.858
Price to revenue (TTM)
0.662
Price to book
1.16
Price to tangible book (TTM)
1.17
Price to free cash flow (TTM)
-8.287
Free cash flow yield (TTM)
-12.07%
Free cash flow per share (TTM)
-2.343
Growth
Revenue change (TTM)
16.12%
Earnings per share change (TTM)
-136.03%
3-year revenue growth (CAGR)
-0.53%
10-year revenue growth (CAGR)
3.34%
3-year earnings per share growth (CAGR)
39.27%
10-year earnings per share growth (CAGR)
-15.04%
What the Analysts think about Metallus
Analyst ratings (Buy, Hold, Sell) for Metallus stock.
Analyst projections of the future price of Metallus stock.
Bulls say / Bears say
The five-year DLA contract has a headline value of up to $995 million, with an initial delivery order worth about $125 million. It could bring substantial defence demand, although the full contract ceiling is not guaranteed. (PR Newswire)
Second-quarter sales rose 12% year on year to $341 million, while the order book grew by more than 50%. Long lead times and management’s expectation of slightly better pricing and product mix point to continued near-term demand. (The Motley Fool, PR Newswire)
New bloom reheat and roller furnaces have been commissioned with nearly $100 million of Army funding. The added capacity could help Metallus serve more defence and aerospace demand while limiting the company’s share of the project cost. (PR Newswire)
Higher energy, labour and maintenance costs, together with melt utilisation that remained below plan, offset much of the benefit from stronger prices and shipments. Margins may not improve as quickly as sales unless factory execution catches up. (The Motley Fool)
Despite higher first-half earnings, operating cash flow was a $14.1 million outflow as working capital and pension contributions absorbed cash. Capital spending adds to the demands on cash generation. (StockTitan)
Energy demand could remain uneven: Metallus said producers were cautious about spending until they had more confidence in long-term oil prices. Geopolitical volatility adds to the risk of delayed investment and weaker orders. (The Motley Fool)
Data summarised monthly by Lightyear AI. Last updated on 2 Oct 2026.
Metallus Financial Performance
Revenues and expenses
Metallus Earnings Performance
Company profitability
Upcoming events
No upcoming events
Metallus News
AllArticlesVideos
Funds containing Metallus
AllUSDGBPEUR
Fund name | Fund size | $MTUS weighting |
|---|---|---|
iShares S&P SmallCap 600$IDP6 | $3.2B | 0.04% |
iShares S&P Small Cap 600£ISP6 | £2.4B | 0.04% |
SPDR Russell 2000 US Small Cap€R2US | €4.8B | 0.03% |
SPDR Russell 2000 US Small Cap£R2SC | £4.1B | 0.03% |
iShares MSCI World Small Cap$WSML | $9B | 0.01% |
Data displayed above is indicative only and its accuracy or completeness is not guaranteed. Actual execution price may vary. Past performance is not indicative of future results. Your return may be affected by currency fluctuations and applicable fees and charges. Capital at risk.
Real-time US market data is sourced from the IEX order book provided by Polygon. After-hours US market data is 15 minutes delayed and may differ significantly from the actual tradable price at market open.