Manitowoc/$MTW
1D1W1MYTD1Y5YMAX
Capital at risk
About Manitowoc
Manitowoc Co Inc provides engineered lifting solutions. It designs and manufactures mobile telescopic cranes, tower cranes, lattice-boom crawler cranes, and boom trucks. It offers products under brand names such as Grove, Manitowoc, National Crane, Potain, Shuttlelift, and Manitowoc Crane Care. Its crane products serve dealers, rental companies, contractors, and government entities in diverse markets, including energy production/distribution and utility, petrochemical and industrial, infrastructure, and commercial/residential construction. Manitowoc has three reportable segments: the Americas, Europe and Africa, and the Middle East and Asia-Pacific. The Americas segment generates the majority of the revenue for the company.
- Ticker
- $MTW
- Sector
- Industrials
- Primary listing
- NYSE
- Employees
- 4,700
- Headquarters
- Milwaukee, United States
- Website
- www.manitowoc.com
Manitowoc Metrics
BasicAdvanced
$749M
37.73
$0.55
1.72
-
Price and volume
Market cap
$749M
Beta
1.72
52-week high
$21.50
52-week low
$9.66
Average daily volume
415K
Financial strength
Current ratio
2.109
Quick ratio
0.698
Long term debt to equity
72.672
Total debt to equity
77.107
Interest coverage (TTM)
1.99%
Profitability
EBITDA (TTM)
140
Gross margin (TTM)
18.72%
Net profit margin (TTM)
0.87%
Operating margin (TTM)
3.39%
Effective tax rate (TTM)
36.88%
Revenue per employee (TTM)
$490,000
Management effectiveness
Return on assets (TTM)
2.57%
Return on equity (TTM)
2.92%
Valuation
Price to earnings (TTM)
37.728
Price to revenue (TTM)
0.319
Price to book
1.07
Price to tangible book (TTM)
1.5
Price to free cash flow (TTM)
10.675
Free cash flow yield (TTM)
9.37%
Free cash flow per share (TTM)
1.947
Growth
Revenue change (TTM)
8.86%
Earnings per share change (TTM)
-56.28%
3-year revenue growth (CAGR)
1.98%
10-year revenue growth (CAGR)
2.20%
3-year earnings per share growth (CAGR)
-43.11%
10-year earnings per share growth (CAGR)
-18.81%
What the Analysts think about Manitowoc
Analyst ratings (Buy, Hold, Sell) for Manitowoc stock.
Analyst projections of the future price of Manitowoc stock.
Bulls say / Bears say
Orders surged 56.1% year-over-year to $708.7 million, driving backlog to a record $1.05 billion at quarter end and evidencing robust demand across crane segments (Reuters).
Net sales rose 10.3% to $594.9 million in Q2 2026, reflecting broad‐based growth in tower crane shipments and aftermarket services (Reuters).
Management raised full‐year 2026 guidance to $2.3–$2.4 billion in net sales, $150–$170 million of adjusted EBITDA, and $0.80–$1.20 in EPS, signaling confidence in sustained market strength (Reuters).
Free cash flow for Q2 2026 was a use of $6 million despite an 85.9% EBITDA increase, highlighting working capital strains and weak cash conversion (Investing.com).
The company carries $469.5 million of debt as of June 30, 2026—$460.6 million in long-term debt and $8.9 million in short-term borrowings—against only $95.8 million of cash, leaving limited cushion for debt servicing in a higher-rate environment (SEC filing).
Manitowoc reported a $6.0 million net loss in Q1 2026, underscoring volatility in quarterly profitability and potential headwinds in used equipment sales (EDGAR).
Data summarised monthly by Lightyear AI. Last updated on 3 Sept 2026.
Manitowoc Financial Performance
Revenues and expenses
Manitowoc Earnings Performance
Company profitability
Upcoming events
No upcoming events
Manitowoc News
AllArticlesVideos
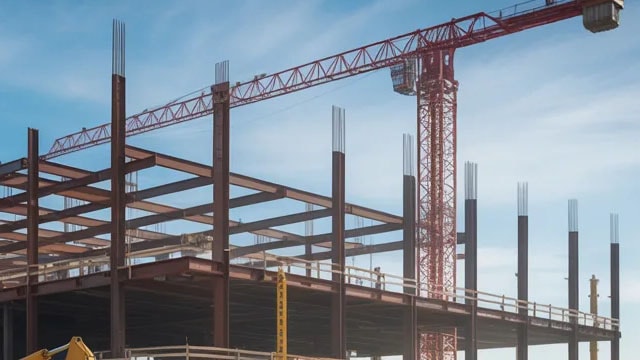
Manitowoc Targets $1B Aftermarket Business as Crane Demand Builds
MarketBeat3 weeks ago

The Manitowoc Company to Present and Host 1x1 Meetings at the Midwest IDEAS Investor Conference on Wednesday, August 26, 2026
Business Wire4 weeks ago

Top 3 Industrials Stocks You May Want To Dump In Q3
Benzinga1 month ago
Funds containing Manitowoc
Fund name | Fund size | $MTW weighting |
|---|---|---|
SPDR Russell 2000 US Small Cap€R2US | €4.8B | 0.02% |
Data displayed above is indicative only and its accuracy or completeness is not guaranteed. Actual execution price may vary. Past performance is not indicative of future results. Your return may be affected by currency fluctuations and applicable fees and charges. Capital at risk.
Real-time US market data is sourced from the IEX order book provided by Polygon. After-hours US market data is 15 minutes delayed and may differ significantly from the actual tradable price at market open.