Nordson/$NDSN
14:30
16:10
17:45
19:25
21:00
1D1W1MYTD1Y5YMAX
About Nordson
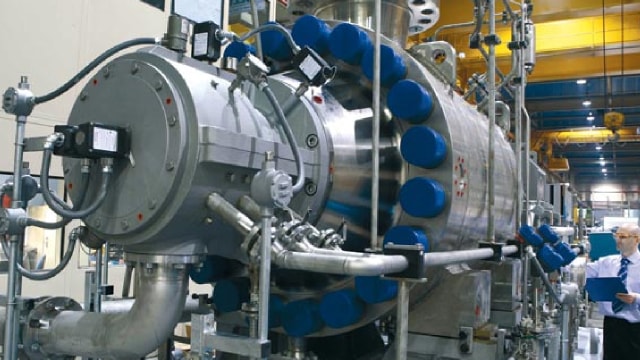
Nordson manufactures equipment (including pumps, valves, dispensers, applicators, filters, and pelletizers) used for dispensing adhesives, coatings, sealants, and other materials. The firm serves a diverse range of end markets including packaging, medical, electronics, and industrial. Nordson's business is organized into three segments: industrial precision solutions, medical and fluid solutions, and advanced technology solutions. The company generated approximately $2.8 billion in revenue in its fiscal 2025.
Ticker
$NDSN
Sector
Primary listing
Employees
8,000
Headquarters
Website
Nordson Metrics
BasicAdvanced
$13B
28.25
$8.51
1.02
$3.16
1.36%
Price and volume
Market cap
$13B
Beta
1.02
52-week high
$251.47
52-week low
$165.03
Average daily volume
497K
Dividend rate
$3.16
Financial strength
Current ratio
1.639
Quick ratio
0.918
Long term debt to equity
55.24
Total debt to equity
68.747
Dividend payout ratio (TTM)
36.96%
Interest coverage (TTM)
7.04%
Profitability
EBITDA (TTM)
874.793
Gross margin (TTM)
55.27%
Net profit margin (TTM)
17.35%
Operating margin (TTM)
26.27%
Effective tax rate (TTM)
18.94%
Revenue per employee (TTM)
$350,000
Management effectiveness
Return on assets (TTM)
7.69%
Return on equity (TTM)
16.21%
Valuation
Price to earnings (TTM)
28.253
Price to revenue (TTM)
4.875
Price to book
4.43
Price to tangible book (TTM)
-14.26
Price to free cash flow (TTM)
20.586
Free cash flow yield (TTM)
4.86%
Free cash flow per share (TTM)
11.679
Dividend yield (TTM)
1.31%
Forward dividend yield
1.36%
Growth
Revenue change (TTM)
3.78%
Earnings per share change (TTM)
4.93%
3-year revenue growth (CAGR)
2.53%
10-year revenue growth (CAGR)
5.16%
3-year earnings per share growth (CAGR)
-1.15%
10-year earnings per share growth (CAGR)
9.45%
3-year dividend per share growth (CAGR)
13.17%
10-year dividend per share growth (CAGR)
13.38%
What the Analysts think about Nordson
Analyst ratings (Buy, Hold, Sell) for Nordson stock.
Nordson Financial Performance
Revenues and expenses
Nordson Earnings Performance
Company profitability
Nordson News
AllArticlesVideos
Data displayed above is indicative only and its accuracy or completeness is not guaranteed. Actual execution price may vary. Past performance is not indicative of future results. Your return may be affected by currency fluctuations and applicable fees and charges. Capital at risk.
Real-time US market data is sourced from the IEX order book provided by Polygon. After-hours US market data is 15 minutes delayed and may differ significantly from the actual tradable price at market open.
Capital at risk
Upcoming events
No upcoming events
FAQs
What’s the current market cap for Nordson stock?
Nordson (NDSN) has a market cap of $13B as of January 04, 2026.
What is the P/E ratio for Nordson stock?
The price to earnings (P/E) ratio for Nordson (NDSN) stock is 28.25 as of January 04, 2026.
Does Nordson stock pay dividends?
Yes, the Nordson (NDSN) stock pays dividends to shareholders. As of January 04, 2026, the dividend rate is $3.16 and the yield is 1.36%. Nordson has a payout ratio of 36.96% on a trailing twelve-month basis.
When is the next Nordson dividend payment date?
The next Nordson (NDSN) dividend payment date is unconfirmed.
What is the beta indicator for Nordson?
Nordson (NDSN) has a beta rating of 1.02. This means that it is more volatile than the market, on average. A beta of 1 would indicate the stock moves in-line with the market, while a beta of 2 would indicate the stock moves twice as much as the market.

