Polaris/$PII
1D1W1MYTD1Y5YMAX
Capital at risk
About Polaris
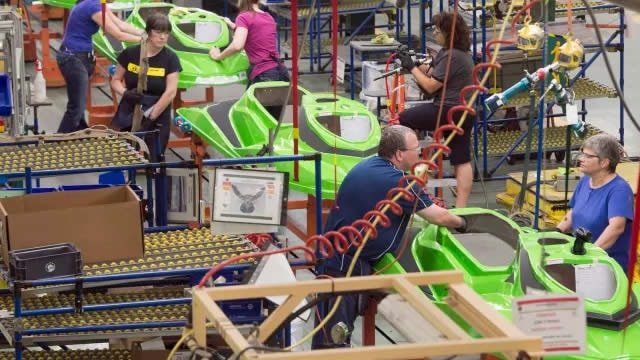
Polaris designs and manufactures off-road vehicles, including all-terrain vehicles and side-by-side vehicles for recreational, utility, military, and commercial purposes, snowmobiles, and on-road vehicles, along with the related replacement parts, garments, and accessories. The firm entered the marine market after acquiring Boat Holdings in 2018, offering exposure to pontoon and deck boat users. It is slated to divest its Indian motorcycle brand to Carolwood in the first quarter of 2026. Polaris products are retailed through more than 2,500 dealers in North America and 1,500 international dealers as well as more than 25 subsidiaries and 90 distributors in more than 100 countries outside North America.
- Ticker
- $PII
- Sector
- Consumer Discretionary
- Primary listing
- NYSE
- Employees
- 14,500
- Headquarters
- Medina, United States
- Website
- www.polaris.com
Polaris Metrics
BasicAdvanced
$3.5B
-
-$4.56
1.26
$2.70
4.43%
Price and volume
Market cap
$3.5B
Beta
1.26
52-week high
$77.98
52-week low
$47.14
Average daily volume
833K
Dividend rate
$2.70
Financial strength
Current ratio
1.2
Quick ratio
0.327
Long term debt to equity
237.776
Total debt to equity
244.899
Interest coverage (TTM)
1.66%
Profitability
EBITDA (TTM)
481.1
Gross margin (TTM)
21.95%
Net profit margin (TTM)
-3.46%
Operating margin (TTM)
2.83%
Effective tax rate (TTM)
11.49%
Revenue per employee (TTM)
$520,000
Management effectiveness
Return on assets (TTM)
2.64%
Return on equity (TTM)
-25.57%
Valuation
Price to revenue (TTM)
0.467
Price to book
4.18
Price to tangible book (TTM)
75.43
Price to free cash flow (TTM)
52.435
Free cash flow yield (TTM)
1.91%
Free cash flow per share (TTM)
1.171
Dividend yield (TTM)
4.40%
Forward dividend yield
4.43%
Growth
Revenue change (TTM)
7.99%
Earnings per share change (TTM)
139.09%
3-year revenue growth (CAGR)
-6.53%
10-year revenue growth (CAGR)
4.69%
3-year earnings per share growth (CAGR)
-24.88%
10-year earnings per share growth (CAGR)
-2.37%
3-year dividend per share growth (CAGR)
1.53%
10-year dividend per share growth (CAGR)
2.26%
What the Analysts think about Polaris
Analyst ratings (Buy, Hold, Sell) for Polaris stock.
Analyst projections of the future price of Polaris stock.
Bulls say / Bears say
Second quarter revenues rose 9% YoY to $2.02 billion and adjusted EPS of $1.97 significantly outpaced the ~$0.72 consensus, underscoring robust ORV demand. (Reuters via Bitget News)
Polaris raised its full-year 2026 adjusted EPS guidance to $3.00–$3.10 (up from $1.60–$1.70) and increased sales guidance to $7.30–$7.50 billion, indicating management’s confidence in sustained growth. (Reuters via Bitget News)
North America ORV retail sales grew 5% YoY in Q2, outperforming the low-single-digit industry average, while adjusted gross profit margin expanded approximately 446 bps, reflecting disciplined pricing and mix. (Investing.com)
Adjusted EPS benefited by $0.96 from a $74 million tariff refund in Q2, raising concerns about the durability of margin expansion once refunds normalize. (Investing.com)
Citi noted that Polaris faces a weak and increasingly promotional end-market amid ongoing tariff uncertainty, which could pressure pricing power and margins. (Reuters via TradingView)
The completed separation and sale of the Indian Motorcycle unit to Carolwood LP in Q1 2026 removes a complementary revenue generator, increasing Polaris’s reliance on its core ORV segment. (Reuters via TradingView)
Data summarised monthly by Lightyear AI. Last updated on 25 Aug 2026.
Polaris Financial Performance
Revenues and expenses
Polaris Earnings Performance
Company profitability
Upcoming events
Polaris News
AllArticlesVideos
Funds containing Polaris
AllEURGBPUSD
Fund name | Fund size | $PII weighting |
|---|---|---|
iShares Ageing Population€AGED | €822M | 0.33% |
SPDR S&P US Dividend Aristocrats€SPYD | €3.3B | 0.13% |
SPDR S&P US Dividend Aristocrats£USDV | £2.8B | 0.13% |
SPDR Russell 2000 US Small Cap€R2US | €4.8B | 0.11% |
SPDR S&P 400 US Mid Cap$SPY4 | $6.3B | 0.09% |
Data displayed above is indicative only and its accuracy or completeness is not guaranteed. Actual execution price may vary. Past performance is not indicative of future results. Your return may be affected by currency fluctuations and applicable fees and charges. Capital at risk.
Real-time US market data is sourced from the IEX order book provided by Polygon. After-hours US market data is 15 minutes delayed and may differ significantly from the actual tradable price at market open.