Shake Shack/$SHAK
1D1W1MYTD1Y5YMAX
Capital at risk
About Shake Shack
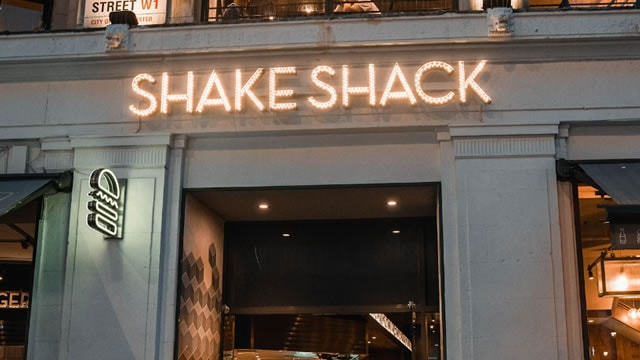
Shake Shack Inc is a roadside burger stand. It serves a classic American menu of premium burgers, hot dogs, crispy chicken, frozen custard, crinkle-cut fries, shakes, beer, wine, and more. The company's burgers are made with a whole-muscle blend of all-natural, hormone and antibiotic-free Angus beef, ground fresh daily, cooked to order, and served on a non-genetically modified organism (GMO) potato bun. Its menu focuses on food and beverages, crafted from a range of classic American foods. The company serves draft Root Beer, seasonal freshly-squeezed lemonade, organic fresh-brewed iced tea, cold brew coffee, organic apple juice, and Shack20 bottled water. Geographically, the company generates the majority of its revenue from the United States.
- Ticker
- $SHAK
- Sector
- Consumer Discretionary
- Primary listing
- NYSE
- Employees
- 13,873
- Headquarters
- New York, United States
- Website
- www.shakeshack.com
Shake Shack Metrics
BasicAdvanced
$2.6B
67.00
$0.95
1.66
-
Price and volume
Market cap
$2.6B
Beta
1.66
52-week high
$107.46
52-week low
$51.60
Average daily volume
1.5M
Financial strength
Current ratio
1.668
Quick ratio
1.533
Long term debt to equity
153.668
Total debt to equity
166.579
Interest coverage (TTM)
27.46%
Profitability
EBITDA (TTM)
172.355
Gross margin (TTM)
40.38%
Net profit margin (TTM)
2.56%
Operating margin (TTM)
3.80%
Effective tax rate (TTM)
33.43%
Revenue per employee (TTM)
$110,000
Management effectiveness
Return on assets (TTM)
1.98%
Return on equity (TTM)
7.94%
Valuation
Price to earnings (TTM)
67.004
Price to revenue (TTM)
1.652
Price to book
4.72
Price to tangible book (TTM)
4.72
Price to free cash flow (TTM)
-218.888
Free cash flow yield (TTM)
-0.46%
Free cash flow per share (TTM)
-0.291
Growth
Revenue change (TTM)
17.33%
Earnings per share change (TTM)
105.16%
3-year revenue growth (CAGR)
16.12%
10-year revenue growth (CAGR)
21.31%
3-year earnings per share growth (CAGR)
103.01%
10-year earnings per share growth (CAGR)
8.89%
What the Analysts think about Shake Shack
Analyst ratings (Buy, Hold, Sell) for Shake Shack stock.
Analyst projections of the future price of Shake Shack stock.
Bulls say / Bears say
Same-Shack sales grew 3.5% in Q2—including 2.0% traffic growth—marking the 22nd consecutive quarter of positive same-Shack sales, underscoring resilient demand (SEC)
System-wide unit count rose 15.2% year-over-year, with a record 16 new company-operated Shacks opened in Q2, demonstrating strong global expansion momentum (SEC)
Comparable app channel sales climbed nearly 30% year-over-year, highlighting the effectiveness of the digital ecosystem in driving guest engagement and repeat visits (SEC)
Beef costs faced mid-teens year-over-year inflation in Q2, driving COGS to a record-high 28.8% of Shack sales and exerting significant margin pressure (SEC)
Restaurant-level profit margin declined 90 basis points year-over-year to 23.0% of Shack sales from 23.9%, reflecting the impact of elevated input and operating costs (SEC)
Shake Shack cut Q2 same-Shack sales guidance to 2.5%–3.0% from 3.0%–5.0% and trimmed full-year adjusted EBITDA outlook to $225 million–$235 million, signaling a cautious near-term outlook amid macroeconomic uncertainty (Reuters)
Data summarised monthly by Lightyear AI. Last updated on 23 Aug 2026.
Shake Shack Financial Performance
Revenues and expenses
Shake Shack Earnings Performance
Company profitability
Upcoming events
No upcoming events
Shake Shack News
AllArticlesVideos


Funds containing Shake Shack
AllUSDGBPEUR
Fund name | Fund size | $SHAK weighting |
|---|---|---|
iShares S&P SmallCap 600$IDP6 | $3.2B | 0.14% |
iShares S&P Small Cap 600£ISP6 | £2.4B | 0.14% |
SPDR Russell 2000 US Small Cap€R2US | €4.8B | 0.08% |
iShares MSCI USA Small Cap ESG Enhanced CTB€SXRG | €2.8B | 0.03% |
iShares MSCI USA Small Cap CTB Enhanced ESG£CUS1 | £2.4B | 0.03% |
Data displayed above is indicative only and its accuracy or completeness is not guaranteed. Actual execution price may vary. Past performance is not indicative of future results. Your return may be affected by currency fluctuations and applicable fees and charges. Capital at risk.
Real-time US market data is sourced from the IEX order book provided by Polygon. After-hours US market data is 15 minutes delayed and may differ significantly from the actual tradable price at market open.