J.M. Smucker/$SJM
14:30
16:10
17:45
19:25
21:00
1D1W1MYTD1Y5YMAX
About J.M. Smucker
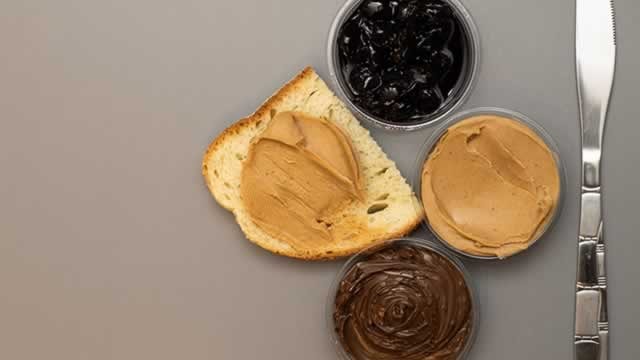
J.M. Smucker is a packaged food company that primarily sells through the US retail channel (73% of fiscal 2025 revenue came through its retail pet foods, coffee, and frozen handheld/spreads segments), with the remaining share consisting of sweet baked snacks (through the Hostess acquisition) and international (primarily Canada). Retail coffee is its largest category (32% of sales) with brands Folgers and Dunkin'. Pet foods (19% of sales) holds leading brands like Milk-Bone and Meow Mix. Of its remaining, approximately 22% comes from frozen handhelds and spreads, through brands Jif, Smucker's, and Uncrustables. The company acquired Hostess Brands in fiscal 2024 to boost its snack and convenience store presence.
Ticker
$SJM
Sector
Primary listing
NYSE
Employees
8,000
Headquarters
Website
J.M. Smucker Metrics
BasicAdvanced
$12B
-
-$11.21
0.21
$4.36
4.02%
Price and volume
Market cap
$12B
Beta
0.21
52-week high
$121.48
52-week low
$93.30
Average daily volume
1.5M
Dividend rate
$4.36
Financial strength
Current ratio
0.885
Quick ratio
0.281
Long term debt to equity
118.369
Total debt to equity
131.357
Interest coverage (TTM)
3.49%
Profitability
EBITDA (TTM)
1,825.3
Gross margin (TTM)
35.14%
Net profit margin (TTM)
-13.61%
Operating margin (TTM)
15.52%
Effective tax rate (TTM)
-8.76%
Revenue per employee (TTM)
$1,100,000
Management effectiveness
Return on assets (TTM)
4.50%
Return on equity (TTM)
-17.44%
Valuation
Price to revenue (TTM)
1.329
Price to book
1.93
Price to tangible book (TTM)
-1.98
Price to free cash flow (TTM)
18.352
Free cash flow yield (TTM)
5.45%
Free cash flow per share (TTM)
5.967
Dividend yield (TTM)
3.98%
Forward dividend yield
4.02%
Growth
Revenue change (TTM)
-0.66%
Earnings per share change (TTM)
-326.58%
3-year revenue growth (CAGR)
2.41%
10-year revenue growth (CAGR)
2.41%
3-year earnings per share growth (CAGR)
28.09%
10-year earnings per share growth (CAGR)
12.65%
3-year dividend per share growth (CAGR)
2.74%
10-year dividend per share growth (CAGR)
5.22%
What the Analysts think about J.M. Smucker
Analyst ratings (Buy, Hold, Sell) for J.M. Smucker stock.
J.M. Smucker Financial Performance
Revenues and expenses
J.M. Smucker Earnings Performance
Company profitability
J.M. Smucker News
AllArticlesVideos
Data displayed above is indicative only and its accuracy or completeness is not guaranteed. Actual execution price may vary. Past performance is not indicative of future results. Your return may be affected by currency fluctuations and applicable fees and charges. Capital at risk.
Real-time US market data is sourced from the IEX order book provided by Polygon. After-hours US market data is 15 minutes delayed and may differ significantly from the actual tradable price at market open.
Capital at risk
Upcoming events
No upcoming events
FAQs
What’s the current market cap for J.M. Smucker stock?
J.M. Smucker (SJM) has a market cap of $12B as of February 07, 2026.
What is the P/E ratio for J.M. Smucker stock?
The price to earnings (P/E) ratio for J.M. Smucker (SJM) stock is 0 as of February 07, 2026.
Does J.M. Smucker stock pay dividends?
Yes, the J.M. Smucker (SJM) stock pays dividends to shareholders. As of February 07, 2026, the dividend rate is $4.36 and the yield is 4.02%. J.M. Smucker has a payout ratio of 0% on a trailing twelve-month basis.
When is the next J.M. Smucker dividend payment date?
The next J.M. Smucker (SJM) dividend payment date is unconfirmed.
What is the beta indicator for J.M. Smucker?
J.M. Smucker (SJM) has a beta rating of 0.21. This means that it is less volatile than the market, on average. A beta of 1 would indicate the stock moves in-line with the market, while a beta of 0.5 would mean it moves half as much as the market.


